

FC7W03NI Work Related Learning -INDIVIDUAL COURSEWORK


Acknowledgement
I would want to extend my heartfelt appreciation to each person who has provided suggestions, details, and support in any way.
I would also want to thank Mr. Rohit Pandey, our module leader, and Islington College for providing all thenecessary help and services. The timely completion of this project would not have been possible without their supervision and guidance.
Glossary and Abbreviations
| S. N | Title | Full Form |
| 1 | RUP | Rational Unified Process |
| 2 | DSDM | Dynamic System Development Method |
| 3 | SSADM | Structured Systems Analysis and Design Method |
| 4 | Prince2 | Projects IN Controlled Environments |
| 5 | SPSS | Statistical Package for the Social Sciences |
| 6 | SAS | Statistical Analysis System |
Table of Contents
- Introduction……………………………………………………………………………………………………………. 1
- Review of Activities………………………………………………………………………………………………… 4
2.1 Discuss the hierarchical framework of the company operations with the Supervisor. (L01) 4
2.2 Gather, understand, and interact with the data sources, as well as the different divisions that use the data. (L02) 4
2.5 Work on data analysis and visualization utilizing a variety of statistical methodologies in order to perform exploratory data analysis. (L05)………………………………………………………………………………… 6
2.6 Explain the exact results of the data analysis in your interpretation of the data. (L06) 7
- Show illustrations and inform the manager of your results. (L07)…………………… 7
- Academic Context……………………………………………………………………………………………….. 10
- Abilities Evaluation………………………………………………………………………………………………. 12
4.1 Discuss the hierarchical framework of the company operations with the Supervisor. (L01) 12
4.2 Gather, understand, and interact with the data sources, as well as the different divisions thatuse the data. (L02) 13
4.5 Work on data analysis and visualization utilizing a variety of statistical methodologies in order to perform exploratory data analysis. (L05)……………………………………………………………………………… 16
4.6 Explain the exact results of the data analysis in your interpretation of the data. (L06) 17
- Show illustrations and inform the manager of your results. (L07)…………………. 17
- Challenges…………………………………………………………………………………………………………… 19
- Conclusions…………………………………………………………………………………………………………. 22
- References………………………………………………………………………………………………………….. 24
- Appendix……………………………………………………………………………………………………………… 25
Table of Figures
Figure 1: Organizational Chart of Informatic computer hub…………………………………………… 2
Figure 2: Learning agreement 1………………………………………………………………………………….. 25
Figure 3: Learning agreement 2………………………………………………………………………………….. 26
Figure 4: Learning agreement 3………………………………………………………………………………….. 28
Figure 5: Internship completion letter………………………………………………………………………….. 29
Figure 6: CV……………………………………………………………………………………………………………….. 31
Figure 7: App of my job 1……………………………………………………………………………………………. 32
Figure 8: App of my Job 2…………………………………………………………………………………………… 33
Figure 9: Udemy class online of R………………………………………………………………………………. 34
Figure 10: Researched text………………………………………………………………………………………… 35
Figure 11: Udemy class online for python…………………………………………………………………… 36
Figure 12: Job interaction hub using slack………………………………………………………………….. 37
Figure 13: Work management method using trello……………………………………………………… 38
Figure 14: By using R studio, programming done (undisclosable)………………………………. 39
Figure 15: Analysis of various dataset t(undisclosable)………………………………………………. 40
Figure 16: Visualization of dataset (undisclosable)……………………………………………………… 41
Figure 17: Private group chat of team members…………………………………………………………. 42
Figure 18: Scandal related of Analytica in cambridge…………………………………………………. 43
Figure 19: scandal related of BJP Facebook………………………………………………………………. 44
Figure 20: right wing policies algorithm of the twitter…………………………………………………… 45
Figure 21: Response from the customers…………………………………………………………………… 46
1 Introduction
I currently work as a data analyst for the Informatic computer hub pvt. ltd IT division. As component of the Work-Related Learning program for my master’s degree, we have to finish at least of 45 working days of internship experience at an IT firm. I chose the Informatic computer hub pvt. ltd because it is a young ITcompany with clients all around Nepal and maintains a substantial amount of data, suggested by Mr. Rohit Pandey, the course leader.
My mentors in data analysis and visualization were Mr. Rakesh Kandel head of business intelligence, and Mr. Sandesh Lamsal, our department supervisor.
The beginning and end dates of my internship were February 20 and April 03, respectively. During working on my internship, I analyzed and visualized the datasets using the techniques I had previously learned in my studies.
1.1 Placement background
Informatic computer hub pvt ltd, a company situated in Samakhushi, was established in 2016. On MST, you can read your own comments and access digital books from any gadget, compete against friends in kahoot competitions, take part in live online classes with the instructors from your educational institution, and eveninteract socially with other individuals while studying through engaging and informative videos. In otherwords, every educational task might be done digitally in an educational organization that makes use of an online learning technology.
The company collaborates with local media for conducting business around the country. We provide IP an infrastructure for hosting electronic books. The company also creates its own educational movies at itsfacility using already existing curricula. We have actors, content creators, and screenwriters for any topic at all stages. We additionally have a team for animation, one for development, one for quality assurance and manufacturing control, one for ingestion, one for sales and advertising, and more.
1.2 Structure and role of the company
There are many units of the Informatic computer hub, and each one employs 3-5 people. In all, there areabout 20 employees. During my time as an intern, I worked as a data
analyst for the company. We were in charge of all platform analytics. The organization chart for the business is shown in the image below.

Figure 1: Organizational Chart of Informatic computer hub
1.3 Department where I worked
I worked as a data analyst in the company. It was my duty as a data analyst to make sure that all system data was displayed on the visualization dashboard in our back office. I realized that I also needed to modifythe dashboard statistics to reflect the new corporate milestones and commercial partnerships. We regularly choose more recent infographics with the ability to present data with several dimensions or variables. We switched from single-variate to multiple-variate evaluation in this way. There were around 4 individuals in our unit, but we also worked closely with other departments.
2 Review of Activities
As a part of the company, my responsibilities were gathering, cleaning, analyzing, interpreting, visualizing,and receiving user feedback on the data. We engage with other publications in order to gather data via Slacks as well as conventional means since product partners with several publications around the country and hosts their eBooks.
We followed the Scrum guidelines and worked in iterations, using Trello to maintain track of our progress. I was successful in achieving all of my objectives for data analysis and visualization throughout my internship. I’ve compiled my learning goals below, which I utilized to accomplish every internship goal.
2.1 Discuss the hierarchical framework of the company operations with the Supervisor. (L01)
Throughout the initial week of the internship, my supervisor and I discussed the broad duties that the team had as well as the hierarchical structures of the company’s operations. He explained my duties and how they’ll impact the project. He provided me with the account login information and explained how our business partners’ data is collected using tools like Dropbox and Google Drive.
The points of contact I would later learn were introduced to me at a virtual meeting that we conducted with other collaborators after a few days.
The Appendix contains evidence supporting this learning objective.
2.2 Gather, understand, and interact with the data sources, as well as the different divisions that use the data. (L02)
The next week during my internship, I requested access to the dataset documents from my mentor. He gave me access to my business account but cautioned me to treat the data carefully. We had a meeting to go through the project’s requirements and possible approaches after thoroughly evaluating the different datasets. I learned that my boss enjoys utilizing the R and Python programming languages for handling the data and the Scrum project management methodology to complete the projects. Slacks was used mostlyfor interaction, while Trello was used to keep track of how we were doing at work.
Instead of just following the standard procedures and practices utilized in my company, I decided to research the tools which were available and would prove most helpful for my project. As a data analyticsresearcher, I was unable to use the currently available SPSS and SAS applications. The best programminglanguages, in my view, were R and Python because they are widely used, open-sourced, and cost nothing. I chose to stick with Scrum because it was already well-known by most of the team members and since switching to a completely other strategy would take an enormous amount of time, energy, and resources. Similarly, I found that Slacks and Trello are better for the same aspects.
The Appendix contains evidence supporting this learning objective.
2.3 Evaluate numerous R and Python-based data analysis programs. (L03)
I had previously acquired a fundamental grasp of both R and Python since I completed modules in both languages as a component of my master’s program. The WRL component gives me the ability to go evenmore into them. I registered with R and Python classes on Coursera and Lynda.com. The books “The Art of R Programming” were utilized by me at this time.
Upon gathering all the relevant datasets, I used Python to combine and merge them into a single file for further study. Every time our team gets out to collect data, multiple datasets must first be combined into onedata set. This is the reason integrating datasets is necessary.
Due to unused repeats and parts, the merged dataset needed to be cleaned. I was able to import, read,and clean CSV files due to my prior Python knowledge in “Programming for Data Analysis”.
2.4 Communication, leadership and cooperation (L04)
The fourth week of my internship focused on soft skills. It is widely agreed upon how technical abilities will aid in your employment whereas soft skills will aid in your advancement. Since serving professionally forthree years, I can discuss the importance of soft skills in the workplace through my personal point of view. I can still clearly remember being nervous on my very first day of work because I didn’t know how the business was operated or who to question. But with time, I was able to acquire all the essential expertise and overcome every challenge.
When I was an intern, our team included four members. Thus, before starting the data analysis andvisualization assignment, we had a conversation and decided on the duties for every worker. Following theScrum approach, we created user stories, gave each one a story point value, and specified a deadline forcompletion. Then, we submitted the user stories to the project management tool Trello so that we couldtrack our advancement. In our team, we carried out the chores in this way.
2.5 Work on data analysis and visualization utilizing a variety of statistical methodologies in order to perform exploratory data analysis. (L05)
During the fifth week of my internship, I kept using Python to review and assess data. Data analysis uses mathematics, statistics, and probabilities. I thoroughly examined the dataset to determine its precise format.The K-Nearest Neighbor approach, Naive Bayes, Logistic regression, and Linear regression were allrendered more accessible as a result. Since the datasets I used needed binary classification, I used logistic regression.
I have to do a lot of research to meet my learning goal. I continued the R and Python courses on Courseraand Lynda which I had already signed up for. I was also able to read more of the “Learn Python the Hard Way” textbooks. Because doing the study was so challenging, I needed to set aside a significant amount of time.
2.6 Explain the exact results of the data analysis in your interpretation of the data. (L06)
I utilized Python throughout the sixth week of my employment to instantly apply the earlier techniques I hadlearned to data. Whenever a user visits our website, creates an account, and subscribes to our materials,their information is saved in the database of our server. My primary goal was to write an algorithm toanalyze this data and display it on the back office. I did this over many datasets using a variety of tools andmethods. The dashboard of the back office was then updated with this data. We have to conduct a great deal of testing to confirm it.
To achieve this learning aim, we had to be in touch both the front end and back-end groups constantly. It was really stressful because the other groups were already busy with different tasks. However, it took me a few trials before I was able to display the needed data accurately.
2.7 Show illustrations and inform the manager of your results. (L07)
In the seventh week of my internship, I utilized R to make graphical illustrations of the data analysis results. The various advanced packages and tools that are previously bundled with R, such as ggplot2, Dplyr, Plotly, and others, significantly increase the complexity and attractiveness of these visualizations. Ggplot2 is the abbreviation for Grammar of Graphics.
I learned that Python is a tool that is commonly used in data science processes and it is particularly suggested for machine learning. This is why I used Python for data analysis but R for data visualization. Using the aforementioned tools and libraries, I was able to accurately show line diagrams, bar graphs, bar charts, histograms, scatter plots, pie charts, and boxplots. I then used the same approach and technique fordisplaying on the dashboard of the back-office.
2.8 Plan and participate in educational events. (L08)
In an effort to gather experience, I requested that my boss schedule sessions with various organizationsthroughout the eighth week of my employment. Fortunately, my supervisor informed us that the head of a marketing and sales staff required training within a few days.
After some preparation, I offered the Sales Head—one of the most genuine persons I’ve yet met—accessto the system’s online training. The old man shared his knowledge with me and opened my eyes to newideas. He would go above and above what was required to inspire the program on his end. Considering the fact that I was the one giving him instructions, I improved my ability to communicate and interact with others. He informed me that he had sent a six-month notification of his decision to retire to his formercompany. Moreover, he described to me how his extensive network and business experience from a long career had given him the opportunity to negotiate for greater salary and contracts in his new firm, which he had founded.
2.9 Understanding the social, legal, and professional facets of the company(L09)
During my ninth week as an intern, I conducted research to understand how data management may impact the firm in terms of the law, society, ethics, and work environment. I learned that European IT companieswho fail to safeguard the data of their customers are subject to penalties and legal action by the General Data Protection Regulation (GDPR), a government agency.
In terms of social effects, I learned that Cambridge Analytica had a big impact on Facebook, which is now known as Meta. After that, Meta allowed third-party apps to acquire user data without the users’ consent inorder to generate money. The knowledge was then used to disadvantage the Republican party and influencethe result in their favor during the 2016 US presidential election. A hefty fine was imposed on Meta.
Russia is also suspected of meddling in the presidential election by operating a variety of social media campaigns to support the Republican Party and discredit the Democratic Party.
2.10 Gather consumer feedback and thoughts(L010)
I took a conscious decision to understand how to gather customer feedback and integrate that information into planned updates during the tenth week of my employment. In order to be user-centric and learn fromcustomer feedback, it is crucial for all enterprises to pay close attention whenever we are interacting withcustomers. As a consequence, there will be moments when we have to put our egos aside for the good of the company and ask for their input to ensure that they are happy.
3 Academic Context
Individuals get the ability to work as data analysts and gain experience in the field through a job-related learning module. This gives the students exposure to a wide range of subjects and gives them the chance to develop practical data management skills. I was extremely ready to begin this experience on my own since I felt it would be worthwhile.
I was fortunate to have lecturers and mentors who were accomplished authorities in their respectivedisciplines. The knowledge and experiences they shared sparked my attention and helped me realize how my own career in data analytics is likely to go. When I was conducting my internship, I distinctly remember reflecting on and contrasting the classroom situations.
3.1 Software Project Management
The emphasis of this subject was still on project management within the context of software development. I employed the Scrum methodology during my internship due to its progressive and customizable nature. Agile concepts form the foundation of Scrum. To outline my ideas, I used planning instruments like an PERTchart and the Gantt chart. Working with my peers, I assessed hazards and developed backup strategies. Iused the COCOMO framework together with the pricing, cash flow, labor estimation, and NVM concepts for the financial evaluation.
I ran tests on issues related to team administration, including daily operations, assigning tasks, and leadership philosophies. During my discussion with CEOs, I expressed my views on recruiting and legalissues, including privacy of data, equality, agreements, and employment possibilities. Along with social issues like secrecy and how they affect the work’s bottom line, we also discussed professional and ethicalissues such the BCS rules of action.
3.2 Cyber Security Management
In this course, we discovered the importance of overseeing digital safety in the modern business setting. I was conscious that the perpetrators were constantly developing cutting-edge tactics, techniques, and procedures (TTPs) for participating with economic espionage and defamation. So, as a data analyst, I talked about the importance of managing information security in addition to its many forms, techniques, ideas, and characteristics with my bosses (InfoSec Communities). I continuously made connections between my actions and methods for determining and assessing risks, like weighted factor analysis, a TVA worksheet, and their results, during the course of my internship.
We discussed how to recognize risks in a business and how to use a variety of approaches to reduce them to a manageable level. The forms, methodologies, components, prerequisites, and phases of a security ofinformation policy, including rules, standards, and procedures, were also discussed. This contains the digital death chain and Mitre Att&ck ideas. During a lecture we gave the group, I discussed my views on cybersecurity audits and related ethical, legal, and commercial challenges. Additionally, they gave me details on relevant security guidelines.
3.3 Programming for Data Analytics
This course helped us set the foundation for strong programming principles by introducing Python application programming for data analytics. We covered a variety of subjects, including input and output of data, flow controls, handling mistakes, and programming data structures. Throughout my internship, I found the information processing and visualization tools I learned in this session to be of utmost use. With the help of both the NumPy and pandas frameworks, I was able to modify data. Using the matplotlib and seaborn libraries, I also produced graphics like histograms and bar charts, box charts, etc. These extensions are highly powerful and are utilized in both academic and professional settings.
The primary concepts we learned in the course, including as patterns, looping, searching, arranging, aggregating, classification, association, linear regression, and matrix operations, were essential for doingdata analysis. Python is the most often used tool for analyzing data, therefore learning its essential concepts in this program has helped me improve my fundamental coding.
3.4 Data Warehousing and Big Data
This topic discussed database principles and systems for managing them in connection to the development of modern enterprise-level databases. In addition to other Big Data technologies, we learned about Hadooparchitectures, data intake, transformation of data, and data management. While working on data projects and during job interviews, the information we acquired about SQL queries proved useful. In this course, I learned how to manipulate data and obtain useful information using Oracle, PostgreSQL, and SQL Server.
In addition, we worked with a range of technologies—including Hadoop, HDFS, MapReduce, Spark,Sqoop, Hive, Pig, and MLlib—in several case studies and gained a
lot of knowledge through practical exercises. I know how to use the big data system ecosystem to put myknowledge regarding the way to evaluate big data to use, while I am conscious of way the data is utilized atdifferent levels. I am aware of both the advantages and disadvantages of technology. Along with that, I’ve learned how to leverage data to spark innovation and boost organizational effectiveness. In this way, this training gave me new perspective on the work I do as a data analyst.
4 Abilities Evaluation
4.1 Discuss the hierarchical framework of the company operations with the Supervisor. (L01)
I met with my supervisor as part of the initial learning objective of my internship, and we discussed thebroad duties assigned to the team as well as the hierarchical framework of the company’s operations. Heexplained my duties and how they’ll impact the project. He provided me with the login details and explainedhow our partners’ data is collected using tools like Skydrive and Google Drive.
The persons I would be routinely speaking with were introduced to me during a virtual conference we conducted a few days later, as I later learned. It was challenging to work with different groups and accents, yet it was also fascinating to listen to whatever each person had to say regarding the various subjects.
I was able to effectively complete my first learning goal by collaborating with my supervisor, colleagues, andthe manager of human resources to gather the pertinent data, get the requirements, and finally use those datasets to create a project plan.
The Appendix contains evidence supporting this learning objective.
4.2 Gather, understand, and interact with the data sources, as well as the different divisions that use the data. (L02)
My second learning objective for the internship was to approach my boss for authorization to access thedataset files. He gave me access to my business account but cautioned me to treat the data carefully. We held a conference to discuss the project’s requirements and potential solutions after thoroughly evaluatingthe various datasets. I learned that my boss enjoys utilizing the R and Python tools to handle the data and the Scrum methodology to complete the assignments. Slacks was used mostly for communication, while Trello was used to keep track of how we were doing at work.
Instead of just following the established methods and practices utilized in my firm, I decided to performresearch on the tools that were available and would prove most helpful for my project. I’d been unwilling toutilize pre-built SPSS and SAS applications as Power BI and Tableau since I was learning data analytics. Inmy perspective, R and Python are the best programming languages since they are widely used, open-sourced, and affordable. I chose to stick with Scrum since it was already being used by most of the staff at the organization and because switching to a whole new strategy would take a lot of time, energy, and resources. I also learned that Slacks and Trello were better.
I achieved my second learning goal by collaborating with my boss to get datasets, studying and choosing R and Python, the Scrum methodology, Slacks, and Trello being the most effective tools for the task. To findout more regarding how they handle the data, I also chatted with the Ingestion team.
Evidence in support of this learning aim may be found in the Appendix.
4.3 Evaluate numerous R and Python-based data analysis programs. (L03)
I already knew the fundamentals of R and Python because I attended classes in both throughout my master’s program. The WRL component gives me the ability to delve further into them. I registered for R andPython courses on Udemy and Lynda.com. During this time, I also used the texts from “The Art of R Programming”. After gathering all the relevant datasets, I used Python to combine and integrate them into asingle file for further study. When our organization sets out to collect data, integrating datasets is necessary since data from many sources must first be combined into one dataset.
The merged dataset needed to be cleaned up because it had unused portions and repeats. I was able toload, read, and clean CSV files thanks to my prior Python expertise on “Programming for Data Analysis”.Parallel to this, I combined data using SQL queries utilizing the various join techniques I learned on in the Big Data and Data Warehousing course. Using built-in procedures and processes, I cleansed the data. The process of importing, reading, cleaning, and integrating databases is known as data wrangling.
The third learning objective was effectively accomplished through research using different data analysis techniques and information wrangling on the merged dataset to conduct more data analysis.
4.4 Communication, leadership and cooperation (L04)
The fourth learning goal of my internship was to develop soft skills. It is widely agreed upon that technical skills will aid in your employment whereas soft skills will aid in your advancement. After working in aprofessional capacity for three years, I am able to speak from experience on the importance on soft skills in the workplace. I can still clearly remember being nervous upon my inaugural day at work since I didn’t know how the business was operated or who to question. However, in a period of time I became able to learn what I needed to know and overcome every challenge.
I learned how important it is to create a friendly atmosphere where everyone can express themselves freely.I came to the conclusion that a tight work environment kills innovation and originality because the fearful employee is always worried about not offending the management. To build our confidence in light of this, wetook great care and spoke about negotiation, emphatic listening, public speaking, and working ethics.
The fourth learning aim was accomplished by focusing on soft skills including team management, leadership, and interpersonal connection.
4.5 Work on data analysis and visualization utilizing a variety of statistical methodologies in order to perform exploratory data analysis. (L05)
The sixth learning goal of my internship was to comprehend and assess data using Python. Data analysis uses mathematics, statistics, and probability. I thoroughly examined the dataset to determine its precise format. This helped me decide between the naive Bayesian Logistic Regression, Linear Regression, and K-Nearest Neighbor technique. Since each data set I utilized required binary classification, I used logistic regression.
However, I was able to learn a few fundamental data analysis techniques that may be used to solve real-world problems. Despite all the challenges, I was able to examine the data and accomplish all of my goalsowing to the supervisor’s strong encouragement and some helpful comments.
I achieved my fifth learning target in this way, utilizing the logistic regression method on Python with the assistance of my supervisor.
4.6 Explain the exact results of the data analysis in your interpretation of the data. (L06)
For the sixth learning outcome of my internship, I utilized Python to combine the prior methodologies I had learned into real-time data. When a person visits our website, creates an account, or subscribes to our materials, the data they supply is saved in our database. My primary goal was to write an algorithm to evaluate this data and display it on the back office. I did this using a variety of packages and methods onseveral datasets. The back-office dashboard was then updated with this data. We have to perform plenty of checks to verify it.
To achieve this learning aim, we needed to be in touch with both the front and back end teams constantly. It was fairly intense because the other groups were preoccupied with other tasks. However, it took me a few trials before I was able to display the needed data accurately. Later, I enhanced the algorithm with the help ofmy supervisor to make it more precise and accurate.
This is how I met my sixth learning goal: I created a number of algorithms and displayed their details on the dashboard.
4.7 Show illustrations and inform the manager of your results. (L07)
For the seventh learning objective of my internship, I utilized R to generate graphical displays of the results of the data analysis. The many advanced libraries and tools that are already built into R, such ggplot2,Dplyr, Plotly, and many more, greatly increase the complexity and appeal of our charts.
My research led me to the conclusion that Python is a tool that is often employed in data science processes and is best suited for machine learning. This is the reason I chose Python for data analysis but R for datavisualization. Using the aforementioned tools and libraries, I was able to accurately show graphs of lines, bargraphs, bar charts, histograms and scatter plots, pie diagrams, and boxplots. After that, I used the same approach and technique to show on the dashboard of our back-office. The results seemed to impress my management.
It was actually one of my first projects utilizing Python and R, so I’m conscious that I still have a lot to learnand research. In the near future, I aim to conduct study in each of those topics.
I used a variety of complex R tools and real-time graph visualization to accomplish my seventh learning target.
4.8 Plan and participate in educational events. (L08)
As the ninth learning objective of the internship, I requested my boss if he could set up discussions with other groups so I could obtain some experience. Fortunately, my supervisor informed us that the head of the sales and marketing department needed training after a few days.
I also got the opportunity to teach a marketing group. They were a group of 4 young individuals that worked together. The training plans created by the young group have a strange quality. They dedicate a lot of additional effort, but they may also be critical and impatient at times. I concentrated on educating them onbetter data collection techniques through a data analyst’s perspective. We talked extensively about their company procedures and labor issues.
I achieved my eight learning objectives by organizing a lesson in which I got the chance to speak withpeople from all walks of life regarding our operational approach and way of life.
4.9 Understanding the social, legal, and professional facets of the company(L09)
On the ninth learning objective of the internship, I did research to understand how utilizing data can have implications for the company in regard to the law, society, morality, and the workplace. I learned that European IT companies who fail to safeguard the data of their customers are subject to penalties and legal action by the General Data Protection Regulation (GDPR), a government agency.
Additionally, it’s believed that Russia meddled in the election for president by operating a variety of social media campaigns to undermine the Democratic Party and support the Republican Party online. Additionally, there were speculations claiming the Indian government (the BJP) was prepared to reduce Facebook’s taxes in exchange for Facebook charging less for promoting the BJP’s propaganda video than its rival organizations. All of these circumstances raise significant “ethical” and “professional” questions, as well asthe impact that influential media companies have on the democratic foundation of elections. These subjects need to be discussed more.
I was able to complete my ninth learning objective by researching the possible legal in nature, ethical, social, and professional ramifications associated with a data breach or data misuse.
4.1 Gather consumer feedback and thoughts(L010)
My internship’s tenth and last learning objective was to figure out how to get client feedback and incorporate it into subsequent enhancements. Every business is built on becoming client-centric and learning from customer feedback, therefore while we are working with customers, we must constantly be on guard. As a consequence, there will be moments when we have to put our egos aside for the good of the company and ask for their input to ensure that they are happy. In this way, I met my ninth learning goal.
5 Challenges
Being a data analyst for the first time made it challenging in a variety of ways. I encountered obstacles throughout the course of the project on the technical skills, relationships, as well as some forced fronts. Despite these difficulties, I was still able to develop my essential data analysis skills and broaden myexperience. Thanks to the help
I had with my supervisor and my classmates, I was able to complete the project on time, and I’m quite happy and satisfied about that. I’ve emphasized the three challenges that were the most challenging for me to overcome.
5.1 Management of Time
Time management was quite challenging for me since I had to juggle a full-time job with my college schoolwork. I struggled to balance this assignment’s research requirements with the assignments for my other classes. I had already finished the WRL curriculum during my undergraduate studies, so in a way Iknew what to expect. As a consequence, I prepared ahead of time. At this period, catching up withcoworkers and going on outings were discouraged.
In the end, I changed my goals and schedule. I learned something new every day, and soon things began to make sense. I learned how to deal with uncertainty and advance. This allowed me to develop importanttime management skills, and I am confident in my capacity to do so in the future.
5.2 Development skills and Data Analysis
Prior to this internship, my knowledge in the use of R and Python for data analysis and development was limited to what I had acquired in my education. I lacked any project- specific knowledge. I struggled to get my work going. I had to devote a lot of time in research, which helped me hone my data analysis skills. By enrolling in online courses on Coursera and Udemy, I did research. Since they are more in-depth, I also read a few books. I also spoke with my management and my coworkers to seek their suggestions. I ultimately developed strong data analysis and creation skills and was able to complete the work at hand.
5.3 Communication
I discovered throughout my internship that everyone has their own limitations, making effective engagement challenging. I learned that we need to be more attentive and understand everyone’s psychological intelligence so as to communicate effectively. Alternately, there is always a possibility ofmiscommunication, which might be detrimental to the work at hand.
We used advanced job-planning programs like Trello and business communication systems like Slack, but we still had a lot of trouble interacting with other departments. I reached the decision that talking things outin person was the best course of action. I also learned that speaking discreetly entails paying close attention, making allowances, and having a growth mindset. I had the good fortune to increase my communication skills in this way.
6 Conclusions
During my internship, I was aware of how unprepared I had been for the real world of work. I understood that if I wanted to grow, I had to overcome my habit of staying in my comfortable surroundings, put in a lot ofeffort, grow more independent, and be proactive.
During the debate with my elders, I learned that competitive organizations use psychological tests to evaluate beliefs, attitudes, past experiences, our upbringing, and other elements. Some people are devout, socially conscious, economically motivated, etc. by nature. This is done to lessen the risks associated with recruiting or advocating. While the work experience proved far from a psychological evaluation, I am now more certain that my cognitive abilities are on level with those of others in the industry and that I feel no better than anyone.
I am eager to use the teamwork, organization of time, analysis of data, and graphical presentation abilities I have gained to my next responsibilities. I was able to find some fantastic materials with the assistance ofmy supervisor. I was able to go on with my data analytics project thanks to the assistance of the job-relatededucation component. In this way, the internship gave me the chance to put my strength to the test by diving to the bottom of the deepest ocean. I’m eager to investigate the fresh possibilities that lie ahead.
6.1 Future Plan
I had already finished a preliminary project for the course in Python on programming for analytics in data that involved analyzing data and visualization. To analyze and display the information contained in this WRLcomponent, I utilized R and Python. I still have one more project to do for the Analysis of Data and Visualization section. Finally, I want to develop a spectacular project on the report from the previoussemester for my course. As soon as my last year is through, I plan to change jobs and apply for the position of data scientist using the work mentioned above as a résumé. I want to apply both the hard skills and soft skills I’ve acquired. I’m overjoyed that the perfect scenario I had pictured prior participating in a graduate degree is approaching.
7. References
Restori, M., no date. What is Exploratory Data Analysis. [Online] Available at: https://chartio.com/learn/data-analytics/what-is-exploratory-data-analysis/ [Accessed 7 1
2022].
8. Appendix
8.1 WRL Form

Figure 2: Learning agreement 1

Figure 3: Learning agreement 2


Figure 4: Learning agreement 3
8.3 Internship Completion Letter

Figure 5: Internship completion letter
8.4
CV

8.5 Evidence
8.5.1 Evidence of L01

Figure 7: App of my job 1

8.5.2 Evidence of L02

Figure 9: Udemy class online of R

8.5.3 Evidence of L03

Figure 11: Udemy class online for python
8.5.4 Evidence of L04
Figure 12: Job interaction hub using slack

Figure 13: Work management method using trello
8.5.5 Evidence of L05

Figure 14: By using R studio, programming done (undisclosable)
8.5.6 Evidence of L06

Figure 15: Analysis of various dataset t(undisclosable)
8.5.7 Evidence of L07

Figure 16: Visualization of dataset (undisclosable)
8.5.8 Evidence of L08

Figure 17: Private group chat of team members
8.5.9 Evidence of L09

Figure 18: Scandal related of Analytica in cambridge
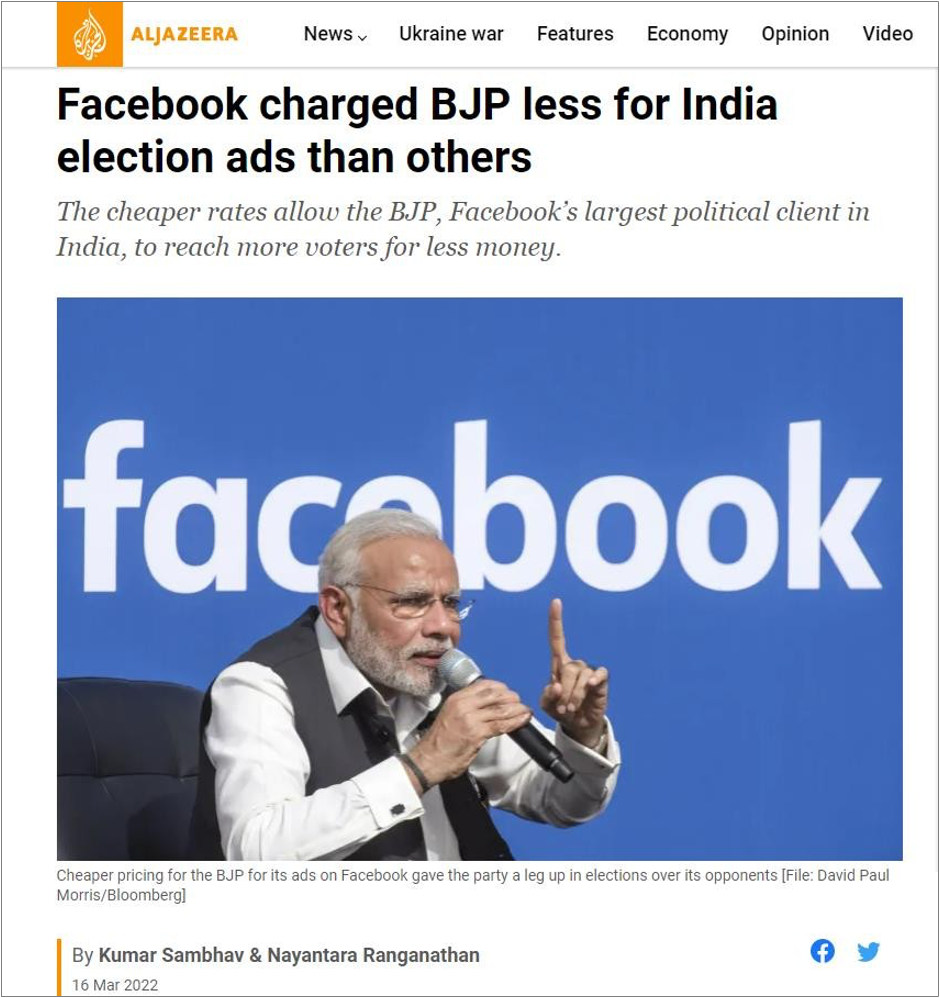
Figure 19: scandal related of BJP Facebook

Figure 20: right wing policies algorithm of the twitter
8.5.10 Evidence of L010

Figure 21: Response from the customers