

Thesis : Nepali Text Document Classification using Deep Neural Networks


Declaration of the Student
I hereby certify that I am the sole author of this work and that it has solely used the sources that are specified above.
……………..
Roshan Sah
Suggestion from the Supervisor
I hereby suggest that this dissertation, ” An In-Depth Proposal for Nepali Text Document Classification Leveraging Deep Neural Networks” completed under the guidance of Dr. Sushil Shrestha, be processed for evaluation in partial fulfilment of the requirements for the degree of MSC IT IN DATA ANALYTICS.
.. ……………
PhD in Learning Analytics
Assistant Professor | Department of Computer Science and Engineering (DoCSE)
Kathmandu, Nepal
Date: May, 2024
APPROVAL LETTER
We attest that we have read this dissertation and that, in our judgement, it satisfies the requirements for both scope and quality as a dissertation for the master’s degree in computer science and information technology.
Evaluation Committee
……………………………….Dr. Sushil ShresthaPhD in Learning AnalyticsAssistant Professor | Department of Computer Science and Engineering (DoCSE)Kathmandu, Nepal (Head) | ………………………………Dr. Sushil ShresthaPhD in Learning AnalyticsAssistant Professor | Department of Computer Science and Engineering (DoCSE)Kathmandu, Nepal (Supervisor) |
…………………… (Internal examiner) | ……………………(External examiner) |
Date: May, 2024
ACKNOWLEDGEMENTS
Above all, I am immensely grateful to my supervisor, Dr. Sushil Shrestha. This job would have been difficult to achieve without their assistance, involvement, encouragement, and support. I greatly appreciate your extensive support and profound understanding.
I would like to convey my profound appreciation to Islington College for granting me a scholarship that greatly facilitated the smooth execution of my research project.
I would like to convey my appreciation to all those who provided support to me during the duration of my research work for my M.Sc. IT.
I express my sincere gratitude to all the faculty members and staff of Information Technology for their generous assistance and cooperation during my academic tenure.
I would want to extend my appreciation to all individuals who have been directly or indirectly involved in assisting me in completing my research project.
Lastly, I would want to express my gratitude to my family and friends for their unwavering support and encouragement during my research endeavor.
Roshan Sah
May, 2024
ABSTRACT
The objective of a document categorization task is to allocate a document to one or many classes or categories. This research examines the categorization of Nepali and English text documents using neural networks such as RNN (Recurrent Neural Network) and MNN (Multi Neural Network). It also compares the performance of RNN and MNN based on established performance assessment parameters. The experimental findings demonstrated that the Recurrent Neural Network (RNN) had superior performance compared to the Multilayer Neural Network (MNN).
Keywords: Document classification, Recurrent Neural Network (RNN), Multilayer Neural Network (MNN), Neural Network, Artificial Intelligence (AI)
Table of Contents
1.1.1 An artificial neural network
1.1.2 RNN (Recurrent Neural Network)
BACKGROUND AND LITERATURE REVIEW
2.1.5 Cross-Entropy Loss Function
2.1.6 Gradient Descent Algorithm
2.1.7 A Deep Network Problem with Vanishing/Explosing Gradient
2.1.9 LSTM (Long Short-Term Memory)
3.2 Steps in Text classification
3.3 Performance Evaluation Parameter
4.3 Mathematical Implementation of Classifier
4.4 Programming Language and TensorFlow
5.1.2 Splitting the dataset into training and testing sets
5.1.2.1 Conducting the Experiment 1
5.1.2.2 Conducting the Experiment 2
5.1.2.3 Conducting the Experiment 3
5.1.2.4 Conducting the Experiment 4
5.1.2.5 Conducting the Experiment 5
5.1.2.6 Conducting the Experiment 6
5.1.2.7 Conducting the Experiment 7
5.1.2.8 Conducting the Experiment 8
5.1.2.9 Conducting the Experiment 9
5.1.2.10 Conducting the Experiment 10
5.2 Bar Chart Analysis of Result of Experiment
5.2.1 Nepali Dataset test with 20% of sample data for MNN with all 5 experiments
5.2.2 Nepali Dataset test with 20% of sample data for RNN
6.2 Practical/Theoretical/Managerial/Research Contribution
LIST OF TABLES
Table 1Vector representation of sentences
Table 2 Confusion Matrix for the sample
Table 3 No of sample on Train set
Table 4 No of sample on Test set for specific class
Table 5 Hyperparameters and final loss
Table 6 Confusion matrix for Nepali Data of MNN
Table 7 Hyperparameters and final loss
Table 8 Confusion matrix for Nepali Data of MNN
Table 9 Hyperparameters and final loss
Table 10 Confusion matrix for Nepali Data of MNN
Table 11 Hyperparameters and final loss
Table 12 Confusion matrix for Nepali Data of MNN
Table 13 Hyperparameters and final loss
Table 14 Confusion matrix for Nepali Data of MNN
Table 15 Hyperparameters and final loss
Table 16 Confusion matrix for Nepali Data of MNN
Table 17 Hyperparameters and final loss
Table 18 Confusion matrix for Nepali Data of MNN
Table 19 Hyperparameters and final loss
Table 20 Confusion matrix for Nepali Data of MNN
Table 21 Hyperparameters and final loss
Table 22 Confusion matrix for Nepali Data of MNN
Table 23 Hyperparameters and final loss
Table 24 Confusion matrix for Nepali Data of MNN
TABLE OF FIGURES
Figure 1 working of single-layer perceptron network
Figure 2 Graph of ReLU mapping input to corresponding output.
Figure 3 Graph of Tanh activation function mapping input to corresponding output.
Figure 4 gradient descent when slope is positive.
Figure 5 gradient descent when slope is negative
Figure 6 Simple Recurrent Neural Network (RNN) with BPTT
Figure 7 block diagram of RNN cell.
Figure 8 block diagram of LSTM cell.
Figure 9 Block Diagram of Steps in Text Classification
Figure 10 Block Diagram of Over All Classification System
Figure 11 Simple multi-layer neural network
Figure 12 Simple Recurrent Neural Network (RNN)
Figure 13 Block diagram of Data flow graph of TensorFlow
Figure 14 Bar chart for Nepali Data of MNN
Figure 15 Bar chart for Nepali Data of RNN
Figure 16 dataset sample from business category
Figure 17 dataset sample from interview category
Figure 18 preparation of dataset from text
Figure 19 python script to filter data set
Figure 20 python script to shape data set
Figure 21 python script to train model
Figure 22 gaant chart defining time spent in each step of the project
Figure 23 originality report 1
Figure 24 originality report 2
CHAPTER 1
INTRODUCTION
1.1 Overview
Deep Learning is a recently developed field of research within Machine Learning that aims to bring Machine Learning closer to its original purpose of achieving Artificial Intelligence.
Artificial intelligence (AI), sometimes known as machine intelligence (MI), refers to the intelligence exhibited by machines, as opposed to the natural intelligence (NI) observed in humans and other animals. AI research in computer science is the investigation of “intelligent agents,” which refers to any technology capable of seeing its surroundings and making decisions that optimize its likelihood of accomplishing its objectives [P. David, 1998]. Artificial intelligence refers to the application of machines that imitate “cognitive” functions associated with human minds, such as “learning” and “problem solving” [G. Brewka, 2009]. Artificial intelligence (AI) is a field within computer science that focuses on developing machines capable of performing tasks and responding in a manner similar to humans. Artificial intelligence is a discipline within computer science that seeks to develop machines capable of exhibiting intelligent behavior. It has become a crucial component of the technological sector.
Machine learning is a branch of computer science that employs statistical methods to enable computer systems to learn and enhance their performance on a particular task using data, without the need for explicit programming [A. L. Samuel, 1969]. Machine learning and computational statistics are intimately intertwined, having significant overlap in their objectives of utilizing computers to make predictions. The field has a close relationship with mathematical optimization, which provides methods, theory, and application domains. Machine learning is occasionally confused with data mining.
Deep learning is a subset of machine learning techniques that focus on learning data representations rather than using unique algorithms for each task. Learning can be categorized into three types: supervised, semi-supervised, or unsupervised [J. Schmindhuber, 2015]. Deep learning models have been utilized in various domains such as computer vision, speech recognition, natural language processing, audio recognition, and social network filtering. In these areas, these models have achieved outcomes that are equivalent to, and in certain instances, surpass human expertise [D. Ciregan, 2012].
Deep learning refers to a category of machine learning algorithms that are characterized by their depth and complexity.
❖ Employ a series of interconnected layers of nonlinear processing units to extract and transform features. Each subsequent layer use the output from the preceding layer as its input.
❖ Learning can be either supervised, such as in classification tasks, or unsupervised, such as in pattern analysis.
❖ Acquire knowledge about many layers of representations that correspond to different degrees of abstraction; these layers create a hierarchical structure of concepts.
This study examines the efficacy of Recurrent Neural Networks (RNNs) and Multi Neural Networks (MNNs) in classifying Nepali text documents. The primary objective is to analyse how different hyperparameter configurations affect their performance. The objective of the study is to assess and contrast the effectiveness and precision of Recurrent Neural Networks (RNNs) and Multilayer Neural Networks (MNNs) in the task of categorising documents. Additionally, the study intends to pinpoint the main obstacles encountered while employing these advanced learning algorithms on Nepali language. In addition, the project aims to identify techniques for enhancing the efficiency of Recurrent Neural Networks (RNNs) and Multilayer Neural Networks (MNNs) in this specific scenario. Furthermore, this study also investigates the practical consequences of employing these algorithms for real-life applications in the classification of Nepali text documents. The classification method pays particular attention to how RNNs and MNNs deal with the intricacies of the Nepali language, including morphology, syntax, and semantics.
1.1.1 An artificial neural network
An artificial neural network (ANN) or neural network is a type of computing system that is designed based on the structure and function of biological neural networks found in brains. These systems enhance their performance on tasks by learning from examples, typically without the need for programming specialised to the task. Artificial intelligence (AI) has made significant progress, enabling the use of artificial neural networks (ANNs). Artificial Neural Networks (ANNs) are capable of efficiently solving intricate issues within a realistic timeframe. Artificial Neural Networks (ANNs) are conceptual tools that facilitate the comprehension of how neural input is processed [M. van Gerven, 2017].
An artificial neural network (ANN) is constructed from interconnected units or nodes known as artificial neurons. Every link between artificial neurons has the ability to convey a signal from one neuron to another. The artificial neuron that receives the signal has the ability to analyze and interpret it, and subsequently transmit signals to other artificial neurons that are linked to it.
1.1.1.1 The mathematical representation of an artificial neuron
In figure 1, the functioning of multi-neural networks can be comprehended by examining the operations of a single layer neural network. In a multi-neural network, the computing method remains unchanged, but more hidden layers are incorporated into the network.

Figure 1 working of single-layer perceptron network

1.1.2 RNN (Recurrent Neural Network)
A recurrent neural network (RNN) is a type of artificial neural network in which the units are connected in a directed graph along a sequence. This enables it to demonstrate dynamic temporal behaviour during a sequence of time. Recurrent Neural Networks (RNNs) have the ability to utilise their internal state, or memory, to handle sequences of inputs. Recurrent neural networks (RNNs) possess cyclic connections, which enhance their capability to effectively describe sequential input. [H. Sak, 2018]
In a conventional neural network, it is assumed that all inputs are independent of one another. However, recurrent neural networks (RNNs) incorporate the concept of input dependencies within words. For example. In order to anticipate the following word in a sentence, Recurrent Neural Networks (RNNs) retain information about words that have been seen a few steps earlier. RNNs are referred to as recurrent because they execute the same operation for each element in a sequence, and the outcome is dependent on the prior calculations. While theoretically, Recurrent Neural Networks (RNNs) have the capability to utilise information from sequences of any length, in practice, they are constrained to only consider a small number of preceding steps. The Recurrent Neural Network employs the backpropagation algorithm, which is utilised for every time step. Backpropagation Through Time (BTT) is a well-recognised term for this concept.
1.2 Problem Statement
Optimally, within the realm of text analysis, the classifier should accurately assign incoming documents to the appropriate pre-established categories used during training, while also identifying documents that do not fit into any of the established categories. This issue is referred to as open world classification or open classification. [G. Fei, 2015]
A vast amount of unstructured and disorganised data is readily available in the digital realm. Directly utilising the data from the source is impracticable due to its unstructured nature. In order to derive any benefit from the supplied data, it is necessary to organise the textual data.
The MNN and RNN approaches are utilised for document classification. This research aims to investigate the impact of varying hyperparameter settings on the performance of a neural network model and to determine the efficiency of MNN and RNN for document categorization.
The task of analysing and categorising text documents is especially challenging when it comes to the Nepali language. This is because Nepali has distinct linguistic features and there is a large amount of unstructured and disorganised textual data available in digital form. The absence of a well-defined organisational structure in this data frequently hinders the direct extraction of significant insights from the source. Conventional methods for document categorization face difficulties in handling the intricacies of natural language, including the subtleties of syntax, context, and semantics, which are particularly prominent in Nepali literature. In addition, the current body of research on deep learning methods, such as Multi Neural Networks (MNNs) and Recurrent Neural Networks (RNNs), mainly concentrates on languages with extensive collections of texts and well-established datasets. Consequently, there is a lack of application of these techniques to less researched languages like Nepali. This study seeks to close this disparity by examining the efficacy of MNNs and RNNs in classifying Nepali text texts. This study aims to gain useful insights into the application of sophisticated machine learning techniques in efficiently organising and categorising unstructured Nepali text data by examining the effects of various hyperparameter settings on the efficiency and accuracy of deep learning models.
1.3 Objectives
The primary goals of this research are to categorise textual data in the form of text documents using deep learning algorithms such as Recurrent Neural Network (RNN) and Multi Neural Network (MNN). Deep learning computational approaches are utilised to uncover valuable information that is concealed inside data and subsequently categorise it.
1.4 Structure of the report
Chapter 1 introduces deep learning and artificial neural networks, emphasizing their role in advancing machine learning towards artificial intelligence. Chapter 2 covers neural network models, activation functions, and gradient descent algorithms, along with a literature review. Chapter 3 explains dataset preparation, text classification steps, and performance evaluation. Chapter 4 details the implementation of Multi-Neural Network and Recurrent Neural Network models, including mathematical implementations and the use of TensorFlow. Chapter 5 presents the experimental setup and analysis, including ten experiments and results using bar charts. Chapter 6 summarizes the findings and provides recommendations for future research.
CHAPTER 2
BACKGROUND AND LITERATURE REVIEW
2.1 Background
2.1.1 Neural Network Model

2.1.2 Multiple Neural Network
The Multi-layer neural network, also known as the multi-layer perceptron (MLP), is composed of three or more layers. These levels include an input layer, an output layer, and one or more hidden layers. The nodes within these layers are activated in a nonlinear manner, which gives the network its deep structure. The multilayer perceptron is widely recognised as the most prominent and commonly employed form of neural network. Typically, the signals inside the network are transferred unidirectionally, moving from the input to the output. There is no feedback loop in which the output of a neuron influences its own activity. The term used to describe this architecture is “feedforward”. Additionally, there exist feedback networks that have the ability to transmit impulses in both directions as a result of the presence of response links inside the network. These networks possess significant computational capabilities and can be highly intricate [M. Popescu, 2009].
MLPs, or Multi-Layer Perceptron’s, are characterised by their fully linked structure, where each node in one layer is coupled to every node in the subsequent levels through weighted connections. The backpropagation technique is employed to modify the weights in the network. The activation function of a node determines the resulting output of that node.
2.1.3 Activation Function
In computational networks, the activation function of a node determines the output of that node based on a particular input or combination of inputs. A typical computer chip circuit can be viewed as a digital network consisting of activation functions that can be in either a “ON” state (1) or a “OFF” state (0), depending on the input. The activation function plays a crucial role in mapping specific outputs to specific sets of inputs.
2.1.3.1 Rectified Linear Unit (ReLU) Activation Function
The Rectified Linear Unit (ReLU) activation function is utilised in the implementation of the Multi-Neural Network [G. E. Hinton, 2003]. The ReLU function has a domain of all real numbers and a range of values between 0 and 1. The equation representing the boundary of the Rectified Linear Unit (ReLU) is displayed below.


Figure 2 Graph of ReLU mapping input to corresponding output.
Figure 2 depicts the process of assigning input values to their corresponding output values using the Rectified Linear Unit (ReLU) activation function. It showcases the distinct linear segments of the function that intersect at the origin.
2.1.3.2 Tanh activation function
Tanh activation function is implemented for the Recurrent Neural Network.

The range of the tanh function is from -1 to 1
Figure 3 illustrates the Tanh activation function, showcasing how it maps input values to corresponding output values within the range of -1 to 1.

Figure 3 Graph of Tanh activation function mapping input to corresponding output.
2.1.4 SoftMax Function
The SoftMax function takes the output of a neural network, such as o1 from the figure above, as input and produces the output as a probability distribution.
The SoftMax function ensures that the outputs of the neural network add up to 1, allowing them to reflect a probability distribution across mutually incompatible discrete outputs.
The SoftMax function is defined as follows : [Z. Zhang, 2018]

2.1.5 Cross-Entropy Loss Function
The cost function utilised during the training of the neural network model is cross-entropy. The cross-entropy loss function is a technique used to quantify the difference between the projected probability of a neural network model and the expected label or class [Z. Zhang, 2018].
Cost function is given by,

The value of L (loss function) is regarded low when there is a small difference between the predicted probability of the neural network model and the expected result. This indicates that the error or loss of the neural network model is low. Conversely, if the value of L (loss function) increases, it means that there is a larger difference between the projected probability and the expected result.
2.1.6 Gradient Descent Algorithm
Gradient descent is an iterative optimisation process used to discover the minimal value of a function. It operates by taking steps in the direction of the negative gradient of the function. In order to locate a local minimum of a function using gradient descent, one must take steps that are proportional to the negative of the gradient (or an approximation of the gradient) of the function at the current position. If one takes steps proportional to the negative of the gradient, one will move towards a local maximum of the function. This process is referred to as gradient descent.


Figure 4 gradient descent when slope is positive.


2.1.7 A Deep Network Problem with Vanishing/Explosing Gradient
During the training of a neural network model, the issue of vanishing or exploding gradient arises when the derivative of the cost function becomes either exponentially large or exponentially tiny. This phenomenon hinders the training process and makes it challenging.
The Vanishing/Exploding Gradient problem occurs while training a neural network model with backpropagation, particularly in the case of RNNs. During the occurrence of the problem, the duration of the training process is too lengthy, resulting in a decline in accuracy.
During the training process, the neural network continuously computes the cost value. The cost value is calculated as the discrepancy between the anticipated output value of a neural network and the expected value derived from a set of labelled training data.
Cost is minimized by iteratively adjusting the weights during the training phase until the cost value reaches its minimum.
The training method employed a gradient, which quantifies the speed at which the cost will vary in response to a modification in a weight.
2.1.7.1 The disappearing gradient
Neural networks train at a slower pace when the gradient is extremely tiny. The gradient may potentially diminish or dissipate as it propagates through the neural network, causing the initial layers of the network to have the slowest training speed.
The vanishing gradient problem results in the network primarily retaining information from recent occurrences while disregarding information from more distant earlier events. The gradient at any given position is the cumulative result of multiplying the gradients from all preceding points leading up to that point.
2.1.7.1 The Exploding gradient
The phenomenon known as “exploding gradient” refers to the issue of gradients in a neural network becoming extremely large during the training process.
Neural networks train rapidly when the gradient is significantly large. Exploding gradients refer to the issue of significant error gradients accumulating and leading to substantial modifications in the weights of a neural network model during the training process. This leads to instability and an inability of the neural network model to learn from the training data.
2.1.8 Propagation backward
During the training of the network, the loss function (cross-entropy) quantifies the error of the neural network model. The error or cost of the neural network model is determined by calculating the difference between the anticipated output value and the expected output value [D. E. Rumelhart, 1985]. A neural network model computes the error in order to backtrack through the network and modify the weights, aiming to minimize the error in subsequent iterations. Gradient descent is employed to minimize the error of the neural network model. The backpropagation algorithm iteratively adjusts the weights of the neural network by propagating information backwards through the network. This procedure is done for each input in the training dataset. This process is iterated until the error diminishes to a magnitude that allows it to be considered as trained.
2.1.8.1 Back Propagation Through Time (BPTT)
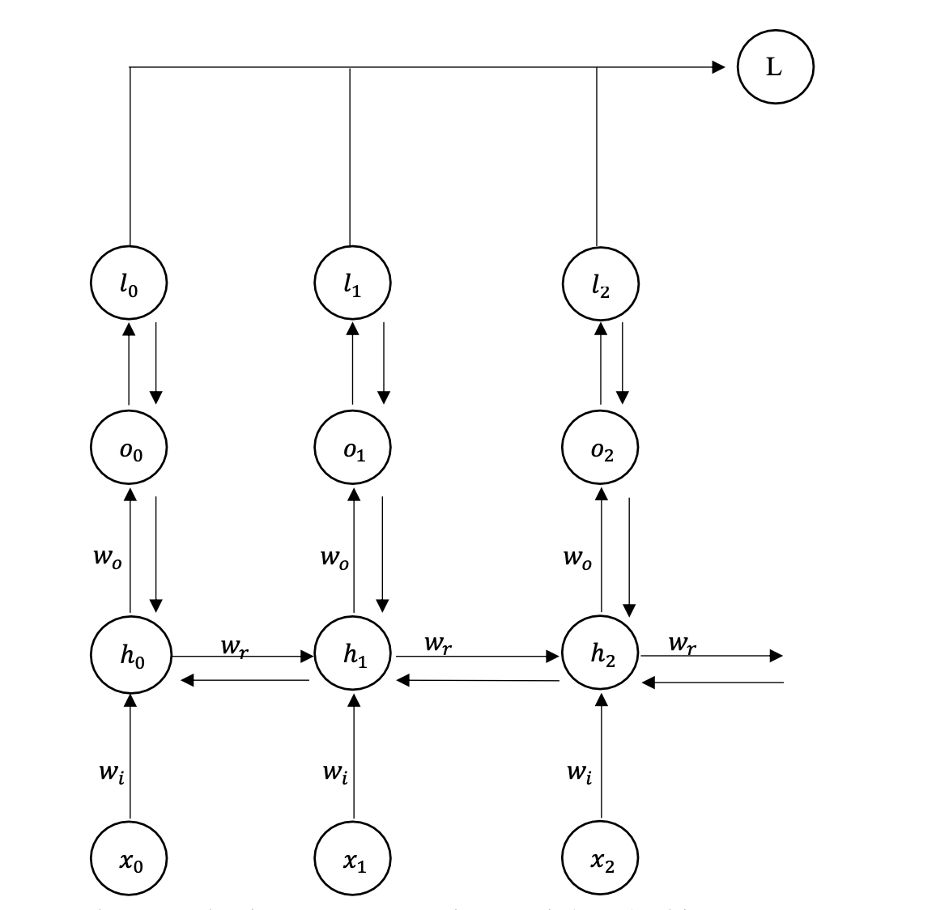
Figure 6 Simple Recurrent Neural Network (RNN) with BPTT
Figure 6 illustrates a Simple Recurrent Neural Network (RNN) with Back Propagation Through Time (BPTT). This process involves computing the error starting from the final output and propagating it backward through the network to adjust the weights and minimize the error.
Backpropagation in feedforward networks involves the reverse movement of information, starting at the final mistake and going through the outputs, weights, and inputs of each hidden layer. The error is computed and an optimizer is subsequently employed to modify the weight, resulting in a reduction of the error.
The loss function is necessary for calculating the backpropagation.

Backpropagation performs computations in the opposite direction of all the steps involved in forward propagation. The backpropagation procedure enables the computation of suitable quantities and the updating of the parameters of the neural network model in order to minimise the generated error.
BPTT use gradient descent to update the weights and biases of a neural network, therefore minimising the error in the network.
2.1.9 LSTM (Long Short-Term Memory)
Long short-term memory (LSTM) units, also known as blocks, serve as fundamental components for the layers of a recurrent neural network (RNN). An RNN consisting of LSTM units is sometimes referred to as an LSTM network. A typical LSTM unit consists of a cell, an input gate, an output gate, and a forget gate. The primary function of the cell in LSTM is to retain and recall information for extended periods, which is why it is referred to as “memory”. Each of the three gates can be conceptualised as a “conventional” artificial neuron, similar to those found in a multi-layer (or feedforward) neural network. In other words, they calculate an activation value by applying an activation function to a weighted sum. Conceptually, they can be understood as controllers of the movement of values that traverse the connections of the LSTM [H. Sak, 2018].
The RNN cell is a basic component that calculates the inputs and bias.
Figure 7 block diagram of RNN cell.


2.2 Literature Review
Warren McCulloch and Walter Pitts developed a computational model for neural networks known as threshold logic in 1943. This model was based on mathematical principles and algorithms. This model was helpful in advancing neural network research. The paper elucidated the functioning of neurons. To elucidate the functioning of neurons in the brain, they constructed a rudimentary neural network by employing electrical circuits [W. S. Mcculloch, 1990]. In 1949, Donald Hebb authored The Organisation of Behaviour, which highlighted the crucial fact that brain pathways are reinforced with each use, a concept that is critically vital to human learning processes. According to his argument, if two nerves simultaneously generate electrical impulses, the strength of the link between them is increased.Rosenblatt (1958) developed the perceptron, an algorithm designed for the purpose of pattern recognition. Rosenblatt utilised mathematical notation to explain circuitry that went beyond the fundamental perceptron, including the exclusive-or circuit, which was not capable of being processed by neural networks during that period [P. J. Werbos, 1974]. This played a crucial role in the subsequent development of the neural network. In 1962, Widrow and Hoff devised a learning algorithm that evaluates the value prior to adjusting the weight (either 0 or 1) based on the following rule:
Weight Change = (Value before weight adjustment) * (Error / (Number of Inputs)).
The concept behind this approach is that if a single active perceptron has a significant error, the weight values can be adjusted to disseminate the error throughout the network, or at least to neighbouring perceptrons. Even when this rule is applied, an error still occurs if the line preceding the weight is 0. However, this problem will eventually be resolved on its own. If the error is evenly spread among all the weights, it will be completely eradicated. They devised a learning algorithm that evaluates the value prior to adjusting the weight. Neural network research saw a lack of progress following the machine learning research conducted by Minsky and Papert in 1969. They identified two fundamental problems with the computational devices used to analyse neural networks. One limitation of basic perceptrons was their inability to comprehend the exclusive-or circuit. The second issue was the insufficient computational capacity of computers to efficiently manage the computational demands of huge neural networks. Progress in neural network research was hindered until computers attained significantly enhanced processing capabilities. In 1975, the first unsupervised multilayered network was established. Rina Dechter proposed the term Deep Learning to the machine learning field in 1986, while Igor Aizenberg and colleagues launched Artificial Neural Networks in 2000. In 1998, Support Vector Machines were utilised for text classification [T. Joachims, 2018]. In 2000, Schapire and Singer improved AdaBoost to effectively handle multiple labels. The approach demonstrated involves treating the task of assigning many subjects to a text as a process of ranking labels for the text. The motivation for this evaluation was derived from the field of Information Retrieval. In 2009, the notion of neural networks resurfaced under a new name, deep learning, introduced by Hinton. In their 2018 study titled “Weakly-Supervised Neural Text Classification,” Yu Meng, Jiaming Shen, Chao Zhang, and Jiawei Han conducted a comparative analysis of the classification capabilities of various neural classifiers. The experiment involved assessing the practical effectiveness of their approach for text classification under weak supervision. The authors suggested a text categorization approach that relies on neural classifiers and is based on weak supervision. This study was notable since it demonstrated that the approach performed better than the baseline methods to a large degree. Additionally, it showed that the method was highly resilient to variations in hyperparameters and different types of user-provided seed information. The suggestion was made to research the effective integration of various types of seed information in order to enhance the performance of the method. The number 19 is enclosed in square brackets. In their 2018 work titled “Practical Text Classification With Large Pre-Trained Language Models,” Neel Kant, Raul Puri, Nikolai Yakovenko, and Bryan Catanzaro discussed the application of large pre-trained language models.The researchers conducted a comparison between the deep learning architectures of the Transformer and mLSTM and discovered that the Transformer outperforms the mLSTM in all categories.The researchers showcased that employing unsupervised pretraining and finetuning offers a versatile framework that proves to be very efficient for challenging text categorization tasks. The researchers discovered that the process of fine-tuning yielded particularly favourable results when applied to the transformer network [N. Kant, R. Puri, 2020]. In their study titled “Long Short-Term Memory Recurrent Neural Network Architectures for Large Scale Acoustic Modelling,” Has ̧Im Sak, Andrew Senior, and Franc ̧Oise Beaufays assessed and compared the effectiveness of LSTM RNN designs in the context of a high-volume voice recognition task known as the Google Voice Search task. The acoustic modelling in this study employed a hybrid technique, combining LSTM RNNs with neural networks to estimate the hidden Markov model (HMM) state posteriors. The researchers demonstrated that deep LSTM RNN architectures reach the highest level of performance for large-scale acoustic modelling. The suggested deep LSTMP RNN structure surpasses the performance of conventional LSTM networks [H. Sak, 2018].
In 1986, Rina Dechter made a significant breakthrough in the field of machine learning by coining the phrase “Deep Learning.” This introduction represented a noteworthy achievement in the advancement of artificial neural networks and the wider field of artificial intelligence. Dechter’s research established the basis for a new era of investigation and practical uses, significantly altering the way neural networks are understood and employed. Prior to Dechter’s invention of deep learning, neural networks were predominantly shallow, comprising only a limited number of layers. Although these networks have their utility in specific tasks, they have inherent limitations when it comes to representing intricate patterns and relationships in data. Deep learning popularised the notion of deep neural networks, which are distinguished by their numerous layers of interconnected neurons. The utilisation of deep architectures allows the networks to acquire hierarchical representations of data, collecting increasingly abstract and complex aspects at higher layers. Dechter’s notion of deep learning highlighted the significance of incorporating multiple layers in neural network topologies. Deep learning models can enhance their ability to extract complex features and recognise patterns by adding more layers. The depth of the models enables them to enhance and expand upon the basic characteristics recognised in previous layers, hence allowing them to identify and comprehend more intricate structures. The power and versatility of deep learning stem from its hierarchical learning process, which allows it to surpass typical shallow networks in a diverse array of tasks. Dechter’s introduction of deep learning has a significant impact that goes beyond theoretical achievements. This resulted in a surge of research and development that resulted in notable practical advancements in diverse fields, such as computer vision, natural language processing, speech recognition, and game playing. The efficacy of deep learning models in various domains has showcased their capacity to effectively extrapolate from extensive datasets, becoming them indispensable for both scholarly investigations and industry implementations. One significant advancement that occurred after Dechter’s presentation was the enhancement of training algorithms for deep networks. Methods such as backpropagation and stochastic gradient descent were improved to effectively deal with the heightened intricacy of deep structures. Furthermore, the progress in processing capacity and the accessibility of extensive datasets facilitated the feasible training of deep learning models, which were previously computationally unaffordable. Dechter’s contribution emphasised the necessity of employing efficient regularisation approaches to mitigate overfitting in deep networks. Techniques such as dropout, batch normalisation, and data augmentation were created to tackle this difficulty, hence improving the effectiveness and resilience of deep learning models. These advancements have played a vital role in guaranteeing that deep learning models exhibit strong generalisation capabilities when presented with unfamiliar data, thereby establishing their reliability for practical use. Ultimately, the introduction of the phrase “Deep Learning” by Rina Dechter in 1986 had a profound impact on the development of artificial intelligence and machine learning. It introduced a novel framework for studying neural networks, highlighting the significance of incorporating several layers in brain structures. Dechter’s research established the foundation for later progress that has resulted in the extensive acceptance and achievement of deep learning models in several domains. Her contribution has a lasting impact on the trajectory of AI research and the advancement of cutting-edge products that leverage the potential of deep learning [Dechter, 1986].
In 2000, Igor Aizenberg and his colleagues made notable advancements in the field of artificial neural networks (ANNs) with their groundbreaking research. Aizenberg et al. largely concentrated on improving the computing capabilities and practical uses of neural networks, which have subsequently become fundamental in the wider field of machine learning and artificial intelligence. Aizenberg et al. played a crucial role in the advancement and use of Multi-Valued and Complex-Valued Neural Networks (MVNNs and CVNNs). These neural networks expanded the conventional binary and real-valued models to include multi-valued and complex domains, allowing for more advanced data representations and processing capabilities. The implementation of these networks resolved certain constraints of traditional ANNs, including in managing intricate input patterns and executing resilient function approximations. Aizenberg and his team’s research emphasised the theoretical and practical advantages of MVNNs and CVNNs. These networks have been demonstrated to provide enhanced learning efficiency and generalisation capabilities, rendering them appropriate for many applications like as image and signal processing, pattern recognition, and data compression. By integrating complicated numbers into the neural network architecture, researchers achieved the ability to simulate and analyse data in ways that were previously unachievable using conventional artificial neural networks. An important achievement of this research was the creation of algorithms that made it easier to train and optimise MVNNs and CVNNs. The algorithms developed by Aizenberg et al. were specifically intended to take use of the distinct characteristics of multi-valued and complex-valued representations. This design choice aims to improve the speed at which the learning process converges and enhance its stability. These developments not only enhanced the efficiency of neural networks in existing tasks but also broadened their suitability for novel and more demanding issues. Aizenberg et al. investigated the incorporation of MVNNs and CVNNs with various neural network topologies and learning methodologies. This interdisciplinary approach facilitated the construction of hybrid models that integrated the advantages of many neural network topologies, resulting in computational systems that are more adaptable and robust. The integration efforts showcased the capacity of these sophisticated neural networks to surpass standard models in multiple domains. Overall, the work of Igor Aizenberg and his colleagues in 2000 represented a noteworthy advancement in the development of artificial neural networks. Their study on Multi-Valued and Complex-Valued Neural Networks expanded the scope of the science, enhancing the efficacy and efficiency of data processing. Aizenberg et al.’s theoretical discoveries and practical implementations have significantly influenced the development of neural network technology, shaping subsequent research and applications in machine learning and artificial intelligence [Aizenberg, 2000].
Practical Text Classification With Large Pre-Trained Language Models authored by Neel Kant, Raul Puri, Nikolai Yakovenko, and Bryan Catanzaro investigates the use of extensive pre-trained language models for tasks involving text classification. This topic holds great importance within the field of natural language processing (NLP), where the precise classification and comprehension of text are vital for a range of applications, such as information retrieval, sentiment analysis, and content suggestion. The researchers conducted a comparative analysis of the performance of two deep learning architectures: the Transformer and the multi-layer Long Short-Term Memory (mLSTM). The Transformer architecture, renowned for its self-attention mechanism, enables the model to assess the significance of various words in a phrase, hence enhancing its ability to capture long-range dependencies more efficiently compared to conventional RNNs. On the other hand, mLSTM networks employ a sequence of LSTM layers to handle sequential data, ensuring that context is preserved across larger sequences. The authors’ research revealed the superior performance of the Transformer design compared to the mLSTM in a range of text categorization tasks. The Transformer’s exceptional performance can be attributed to its capability to effectively handle long-range relationships and its efficient utilisation of computational resources. The study also emphasises the efficacy of unsupervised pre-training followed by fine-tuning for targeted activities. This method utilises extensive quantities of unlabeled text data to acquire comprehensive language representations, which are subsequently adjusted for specific classification tasks using supervised learning. The study emphasises the tangible advantages of employing extensive pre-trained language models in realistic scenarios. The method of fine-tuning has been demonstrated to produce outstanding outcomes by improving the model’s performance on certain tasks, with the need for only a moderate amount of labelled data related to the task. This technique is extremely scalable and cost-effective for a wide range of natural language processing (NLP) applications. Moreover, the work offers valuable understanding regarding the strength and adaptability of extensive pre-trained models. The authors noted that these models demonstrate robustness to changes in hyperparameters and are capable of efficiently using diverse input data. The robustness of text categorization systems is essential for their deployment in diverse and dynamic situations, where the features of the data may vary over time. Neel Kant, Raul Puri, Nikolai Yakovenko, and Bryan Catanzaro’s research on practical text classification with huge pre-trained language models demonstrates the significant influence of these models on NLP tasks. Their research highlights the significance of utilising pre-trained language models, specifically the Transformer architecture, to attain the most advanced performance in text classification. This research not only enhances the science of NLP but also offers practical instructions for developing efficient and precise text classification systems in diverse real-world applications [Kant, 2018].
Long Short-Term Memory Recurrent Neural Network Architectures for Large Scale Acoustic Modelling by Hasim Sak, Andrew Senior, and Francoise Beaufays, investigates the use of Long Short-Term Memory (LSTM) Recurrent Neural Networks (RNNs) in the field of acoustic modelling for speech recognition systems. LSTM networks are specifically designed to identify patterns in sequences of data, making them well-suited for jobs that include sequential data, such as time series, speech, and text. The problem of long-term dependencies, which standard RNNs struggle with due to difficulties such as vanishing and bursting gradients during training, is addressed. LSTMs address this issue by utilising their distinctive architecture, which has memory cells that are equipped with input, forget, and output gates. These gates limit the flow of information and ensure that important material is retained across extended sequences. The objective of this study was to assess the efficiency of LSTM RNN designs in large-scale acoustic modelling and to compare the efficacy of various LSTM architectures, such as deep LSTM networks, in improving speech recognition accuracy. The researchers employed a substantial dataset consisting of acoustic sounds from diverse sources in order to train and assess the LSTM models. Various LSTM topologies were evaluated, including conventional LSTMs, deep LSTMs, and LSTMs with peephole connections. Deep LSTM networks, which involve the arrangement of many LSTM layers in a stacked manner, were utilised to capture more complex and abstract representations of the input data. The models were trained using stochastic gradient descent with backpropagation through time (BPTT) to optimise the network parameters. The study’s findings showed that deep LSTM RNN architectures performed much better than regular RNNs and other baseline models in large-scale acoustic modelling tasks. Deep LSTM networks outperformed conventional LSTM networks and typical RNNs in terms of speech recognition accuracy. Although these models have become more intricate, they have demonstrated their capacity to effectively handle substantial amounts of acoustic data, thereby demonstrating their scalability for voice recognition systems on a broad scale. The work highlights the superior performance of LSTM RNNs in collecting long-term relationships in auditory signals, resulting in greater accuracy in recognition. This characteristic makes them well-suited for speech recognition applications on a broad scale. The consequences of this research are significant for the domain of speech recognition and acoustic modelling. LSTM RNNs have the potential to improve commercial voice recognition systems, such as virtual assistants and automated transcription services, by enhancing recognition accuracy. Furthermore, this study provides opportunities for further investigation into enhancing LSTM designs and examining their potential uses in other tasks using sequential data. The extensive assessment conducted by Hasim Sak, Andrew Senior, and Francoise Beaufays adds to the increasing knowledge on the application of LSTM RNNs in jobs using sequential data, and sets the stage for future progress in the field [Sak, 2014].
Several conventional research avenues in machine learning are driven by the relentless demand of contemporary machine learning models for labelled training data. Weak supervision involves utilising a small amount of supervision, such as a handful of labelled instances or domain heuristics, to train models that can effectively generalise to new, unseen data. Deep neural networks are becoming more popular for the traditional problem of text classification because of their high level of expressiveness and reduced need for feature engineering. Neural text categorization methods have a challenge in real-world applications due to insufficient training data. Supervised text classifiers necessitate substantial human skill and laborious labelling endeavours. In order to tackle this issue, researchers have suggested a weakly supervised method for text classification. This method utilises seed information to create pseudo-labeled documents for initial model training. Subsequently, it further improves the model by using real unlabeled data through a process called bootstrapping. This method, which relies on weak supervision, is adaptable and capable of handling many forms of weak supervision. Additionally, it can be seamlessly included into pre-existing deep neural models designed for text categorization. The results indicate that this strategy produces impressive performance without the need for additional training data and surpasses baseline methods by a wide margin. Another method for weakly-supervised text categorization involves labelling topics generated by Latent Dirichlet Allocation (LDA). This strategy can achieve equivalent effectiveness to the most advanced supervised algorithms in challenging areas that are difficult to categorise. Additionally, it requires no manual knowledge engineering, resulting in very cheap overheads. Furthermore, a very effective weakly-supervised classification method known as FastClass utilises dense text representation to extract class-specific documents from an unlabeled corpus and then chooses the best subset to train a classifier. In contrast to keyword-driven approaches, this strategy relies less on initial class definitions and benefits from significantly faster training speed [Meng, 2018].
CHAPTER 3
RESEARCH METHODOLOGY
3.1 Data Set Preparation
Data is obtained from Sushil Shrestha, who is also serving as the Co-Supervisor for this thesis project. The data comprises a compilation of news articles from Nepal. Data was gathered from multiple online Nepali News sources using a web crawler. The news portal websites ratopati.com, setopati.com, onlinekhabar.com, and ekantipur.com were utilised to collect text pertaining to various news categories. Out of around 20 distinct classes of news data, only two classes were selected for this thesis work. The decision to choose these two classes was based on the magnitude of the available data, as the other classes contained a smaller amount of data. The size of the Business and Interview data was larger compared to the other news data.
3.1.1 Preprocessing
Prior to analysis, unstructured textual data typically necessitates preparation. This process involves several optional processes for preprocessing and cleaning text. These steps include replacing special characters and punctuation marks with spaces, eliminating duplicate characters, removing stop-words set by the user or provided by the system, and performing word stemming. The data is cleaned in this phase and then sent on to another step of data preparation.
3.1.2 Data Vectorization
Vectorization is the process to convert the raw data to the data which can be feed into the computer. There are different types of vectorization methods for this research work Bag of Words model approach is used.
3.1.2.1 Bag of Words model
The bag-of-words model is a simplified representation commonly employed in natural language processing and information retrieval (IR). The vector space model is an alternative name for this concept. This approach represents a text, such as a sentence or a document, as a bag (multiset) of its words. It ignores syntax and word order, but retains the frequency of each word. The bag-of-words paradigm has also been applied in the field of computer vision.
The bag-of-words model is frequently employed in document classification techniques, where the frequency of each word is utilised as a feature for training a classifier. The length of each document used for learning is not standardised. Not all terms in the paper can be used as input features. An analytical method that examines all of these is known as the bag of words approach.
The fundamental concept is to extract the word and calculate the frequency of its recurrence inside the document. The term is regarded as a distinctive characteristic and it possesses exclusivity.
As an illustration, let’s examine the feature called “john” which includes his preferences for watching films and football, as well as his ability to construct phrases.
| Sentence 1: | बैंकले फि, कमिशन, अन्य आम्दानी र बिदेशी सम्बन्धित गतिविधिहरूबाट २३करोड रुपयाँ आर्जन गरेको छ। |
| Sentence 2: | बैंकले फनक्षेप ३१.३४ प्रतिशतले बढेर ६४ अर्ब ४८ करोड रुपैयाँ पुगेको छ भनेकर्जा २८ प्रतिशतले वृद्धि भएर। |
The vector representation of sentences is shown
Table 1Vector representation of sentences
| feature | बिदेशी | कमिशन | आम्दानी | आर्जन | बैंकले |
| Sentence 1 | 1 | 1 | 1 | 1 | 1 |
| Sentence 2 | 0 | 0 | 0 | 0 | 1 |
The sentences are represented as vectors, which are subsequently inputted into the neural network for training and testing.
3.2 Steps in Text classification
The process of text classification is illustrated using a block diagram.

Figure 9 Block Diagram of Steps in Text Classification
Figure 9 depicts the process of text classification through a block diagram.
1. Data Set Preparation: This stage entails the process of readying the dataset for text classification. Text preprocessing involves many processes, such as data cleansing, tokenization, and vectorization, which are used to transform text input into a format that is appropriate for machine learning models.
2. Provide the Vectorized Data: After the dataset has been produced, the vectorized data is inputted into the neural network. The data comprises numerical representations of the text features, which serve as input for the neural network model.
3. Train the Neural Network: The neural network is trained using the data that has been converted into vectors. This process entails passing the input data through the network, calculating the loss, and adjusting the network’s weights using optimisation methods like gradient descent.
In summary, this graphic presents a comprehensive outline of the fundamental stages in text categorization, encompassing data preparation and neural network training.
3.2.1 Block diagram of overall classification system design
The text contains information about the programming language and application programming interface (API) used to design the fundamental elements of a neural network, such as variables, nodes, edges, and activation functions. Developing and executing a Neural Network Model, including the stages for training and testing.

Figure 10 Block Diagram of Over All Classification System
Figure 10 depicts the construction of the classification system, providing a detailed explanation of how the Python programming language and TensorFlow API are utilised to create various elements of the neural network, including variables, nodes, edges, and activation functions. The diagram provides a clear overview of the process for collecting and preprocessing data, as well as the steps involved in data vectorization using techniques such as the Bag of Words model. It also illustrates the necessary preparations for the dataset and the subsequent feeding of vectorized data. Additionally, it highlights the importance of designing both the Recurrent Neural Network (RNN) and Multi Neural Network (MNN), followed by the training and testing of the neural network.
3.3 Performance Evaluation Parameter
It is utilised to assess the efficacy of search results that successfully meet the user’s query. The evaluation criteria used are Precision, Recall, and F-measure. The evaluation parameter necessitates the use of the confusion matrix. A confusion matrix is a tabular representation commonly employed to evaluate the accuracy of a classification model, also known as a “classifier,” using a test dataset where the actual values are known.
Examine the provided confusion matrix for the classification of Nepali news and English news.


Eg. Considering the result from above
tf.argmax(y,1) = 0 and tf.argmax(cL,1) = 0
now correct = tf.equal(tf.argmax(y,1), tf.argmax(cL,1)) then, correct = true
This is the result of one data inside the list of data and for the training process all the list of data goes through same process. correct contain the list of true and false from the result of comparison of all input dataset. correct = [true false true …………………………….]
correct contain length that is equal to the input vector supplied to the network.
4.4 Programming Language and TensorFlow
The programming language utilised is Python. The open source library TensorFlow, developed by the Google Brain Team, is integrated into the system. Originally designed for tasks involving extensive numerical computations, TensorFlow provides the Application Programming Interface (API) for Python. It supports the use of CPUs, GPUs, and distributed processing. The structure of TensorFlow is based on the execution of a data flow graph, which consists of two fundamental components: nodes and edges. Nodes represent mathematical operations, while edges represent multi-dimensional arrays, also known as tensors. The standard procedure involves constructing a graph and subsequently executing it after the session is created. Inputs are provided to nodes through variables or placeholders. A simple example of a graph is displayed below.

Figure 13 Block diagram of Data flow graph of TensorFlow
Figure 13 depicts the data flow graph of TensorFlow, exhibiting its structure through nodes and edges. Nodes symbolise mathematical processes, while edges symbolise multi-dimensional arrays, sometimes known as tensors. The construction and execution of this graph occur within a TensorFlow session, where inputs are supplied to nodes via variables or placeholders.
CHAPTER 5
RESULT AND ANALYSIS
5.1 Experimental Setup
5.1.1 Data set
The Nepali text data is utilised for training the Neural Network. The classes in the Nepali data collection are Interview and Business. The Nepali data set has a total of 32,862 samples. Hyperparameters like as learning rate, epoch, batch size, and hidden layer are selected to carry out various experiments.
5.1.2 Splitting the dataset into training and testing sets
80% of the data from the sample is used to train the Neural Network. Experimental tests are conducted using 20% of the Nepali data to evaluate the classifier.
Table 3 No of sample on Train set
| Sample Data | Total Number | Train (80% of sample) |
| Nepali | 41,078 | 32,862 |
Table 4 No of sample on Test set for specific class
| Sample Data | Class label | Total Number | Total Number |
| Nepali | Business | 16,938 | 16,938 |
5.1.2.1 Conducting the Experiment 1
The MNN was optimised using hyperparameters, and its ultimate loss is displayed here.
Table 5 Hyperparameters and final loss
| Learning rate | Epoch | Batch Size | Hidden Layer | Hidden Unit | Final loss |
| 0.01 | 10 | 100 | 3 | 100 | 410.62 |
A subset of the Nepali data set, comprising 20% of the whole data, is selected for testing purposes. The testing is conducted using the MNN neural network. The term “Not-Business Class” is incorrect. The term “business class” refers to the specific class that is designated and branded as such.
Table 6 Confusion matrix for Nepali Data of MNN
| Predicted Class | |||
| Sample = 3,388 | Business | Not- Business | |
| Actual class | Business | 194 (TP) | 3286 (FN) |
| Not- Business | 3194 (FP) | 102 (TN) | |
Recall =0.055, Precision = 0.057, Accuracy = 0.043
F-Measure = 0.056 , where b = 1
5.1.2.2 Conducting the Experiment 2
The MNN was optimised using hyperparameters, and its ultimate loss is displayed here.
Table 7 Hyperparameters and final loss
| Learning rate | Epoch | Batch Size | Hidden Layer | Hidden Unit | Final loss |
| 0.05 | 15 | 200 | 9 | 200 | 410.62 |
A subset of the Nepali data set, comprising 20% of the whole data, is selected for testing purposes. The testing is conducted using the MNN neural network. The term “Not-Business Class” is incorrect. The term “business class” refers to the specific class that is designated and branded as such.
Table 8 Confusion matrix for Nepali Data of MNN
| Predicted Class | |||
| Sample = 3,388 | Business | Not- Business | |
| Actual class | Business | 1301 (TP) | 1833 (FN) |
| Not- Business | 2087 (FP) | 1555 (TN) | |
Recall =0.415, Precision = 0.284, Accuracy = 0.421
F-Measure = 0.39 , where b = 1
5.1.2.3 Conducting the Experiment 3
The MNN was optimised using hyperparameters, and its ultimate loss is displayed here.
Table 9 Hyperparameters and final loss
| Learning rate | Epoch | Batch Size | Hidden Layer | Hidden Unit | Final loss |
| 0.09 | 20 | 300 | 12 | 300 | 410.62 |
A subset of the Nepali data set, comprising 20% of the whole data, is selected for testing purposes. The testing is conducted using the MNN neural network. The term “Not-Business Class” is incorrect. The term “business class” refers to the specific class that is designated and branded as such.
Table 10 Confusion matrix for Nepali Data of MNN
| Predicted Class | |||
| Sample = 3,388 | Business | Not- Business | |
| Actual class | Business | 807 (TP) | 2755 (FN) |
| Not- Business | 2581 (FP) | 633 (TN) | |
Recall =0.22, Precision = 0.23, Accuracy = 0.21
F-Measure = 0.23 , where b = 1
5.1.2.4 Conducting the Experiment 4
The MNN was optimised using hyperparameters, and its ultimate loss is displayed here.
Table 11 Hyperparameters and final loss
| Learning rate | Epoch | Batch Size | Hidden Layer | Hidden Unit | Final loss |
| 0.5 | 25 | 400 | 15 | 400 | NAN |
A subset of the Nepali data set, comprising 20% of the whole data, is selected for testing purposes. The testing is conducted using the MNN neural network. The term “Not-Business Class” is incorrect. The term “business class” refers to the specific class that is designated and branded as such.
Table 12 Confusion matrix for Nepali Data of MNN
| Predicted Class | |||
| Sample = 3,388 | Business | Not- Business | |
| Actual class | Business | 2032 (TP) | 2142 (FN) |
| Not- Business | 1356 (FP) | 1246 (TN) | |
Recall =0.48, Precision = 0.59, Accuracy = 0.48
F-Measure = 0.53 , where b = 1
5.1.2.5 Conducting the Experiment 5
The MNN was optimised using hyperparameters, and its ultimate loss is displayed here.
Table 13 Hyperparameters and final loss
| Learning rate | Epoch | Batch Size | Hidden Layer | Hidden Unit | Final loss |
| 0.9 | 30 | 500 | 18 | 500 | NAN |
A subset of the Nepali data set, comprising 20% of the whole data, is selected for testing purposes. The testing is conducted using the MNN neural network. The term “Not-Business Class” is incorrect. The term “business class” refers to the specific class that is designated and branded as such.
Table 14 Confusion matrix for Nepali Data of MNN
| Predicted Class | |||
| Sample = 3,388 | Business | Not- Business | |
| Actual class | Business | 2102 (TP) | 2184 (FN) |
| Not- Business | 1286 (FP) | 1204 (TN) | |
Recall =0.49, Precision = 0.62, Accuracy = 0.48
F-Measure = 0.54 , where b = 1
5.1.2.6 Conducting the Experiment 6
The MNN was optimised using hyperparameters, and its ultimate loss is displayed here.
Table 15 Hyperparameters and final loss
| Learning rate | Epoch | Batch Size | Hidden Layer | Hidden Unit | Final loss |
| 0.01 | 10 | 100 | 3 | 100 | 262.26 |
A subset of the Nepali data set, comprising 20% of the whole data, is selected for testing purposes. The testing is conducted using the MNN neural network. The term “Not-Business Class” is incorrect. The term “business class” refers to the specific class that is designated and branded as such.
Table 16 Confusion matrix for Nepali Data of MNN
| Predicted Class | |||
| Sample = 3,388 | Business | Not- Business | |
| Actual class | Business | 1752 (TP) | 1107 (FN) |
| Not- Business | 1636 (FP) | 2281 (TN) | |
Recall =0.61, Precision = 0.51, Accuracy = 0.59
F-Measure = 0.56 , where b = 1
5.1.2.7 Conducting the Experiment 7
The MNN was optimised using hyperparameters, and its ultimate loss is displayed here.
Table 17 Hyperparameters and final loss
| Learning rate | Epoch | Batch Size | Hidden Layer | Hidden Unit | Final loss |
| 0.05 | 15 | 200 | 6 | 200 | 139.32 |
A subset of the Nepali data set, comprising 20% of the whole data, is selected for testing purposes. The testing is conducted using the MNN neural network. The term “Not-Business Class” is incorrect. The term “business class” refers to the specific class that is designated and branded as such.
Table 18 Confusion matrix for Nepali Data of MNN
| Predicted Class | |||
| Sample = 3,388 | Business | Not- Business | |
| Actual class | Business | 1850 (TP) | 1067 (FN) |
| Not- Business | 1538 (FP) | 2321 (TN) | |
Recall =0.63, Precision = 0.54, Accuracy = 0.61
F-Measure = 0.58 , where b = 1
5.1.2.8 Conducting the Experiment 8
The MNN was optimised using hyperparameters, and its ultimate loss is displayed here.
Table 19 Hyperparameters and final loss
| Learning rate | Epoch | Batch Size | Hidden Layer | Hidden Unit | Final loss |
| 0.09 | 20 | 300 | 9 | 300 | 92.4 |
A subset of the Nepali data set, comprising 20% of the whole data, is selected for testing purposes. The testing is conducted using the MNN neural network. The term “Not-Business Class” is incorrect. The term “business class” refers to the specific class that is designated and branded as such.
Table 20 Confusion matrix for Nepali Data of MNN
| Predicted Class | |||
| Sample = 3,388 | Business | Not- Business | |
| Actual class | Business | 1880 (TP) | 987 (FN) |
| Not- Business | 1508 (FP) | 2401 (TN) | |
Recall =0.65, Precision = 0.55, Accuracy = 0.63
F-Measure = 0.6 , where b = 1
5.1.2.9 Conducting the Experiment 9
The MNN was optimised using hyperparameters, and its ultimate loss is displayed here.
Table 21 Hyperparameters and final loss
| Learning rate | Epoch | Batch Size | Hidden Layer | Hidden Unit | Final loss |
| 0.5 | 25 | 400 | 12 | 400 | 82.01 |
A subset of the Nepali data set, comprising 20% of the whole data, is selected for testing purposes. The testing is conducted using the MNN neural network. The term “Not-Business Class” is incorrect. The term “business class” refers to the specific class that is designated and branded as such.
Table 22 Confusion matrix for Nepali Data of MNN
| Predicted Class | |||
| Sample = 3,388 | Business | Not- Business | |
| Actual class | Business | 1878 (TP) | 1008 (FN) |
| Not- Business | 1510 (FP) | 2380 (TN) | |
Recall =0.65, Precision = 0.55, Accuracy = 0.62
F-Measure = 0.59 , where b = 1
5.1.2.10 Conducting the Experiment 10
The MNN was optimised using hyperparameters, and its ultimate loss is displayed here.
Table 23 Hyperparameters and final loss
| Learning rate | Epoch | Batch Size | Hidden Layer | Hidden Unit | Final loss |
| 0.09 | 30 | 500 | 18 | 500 | 102.01 |
A subset of the Nepali data set, comprising 20% of the whole data, is selected for testing purposes. The testing is conducted using the MNN neural network. The term “Not-Business Class” is incorrect. The term “business class” refers to the specific class that is designated and branded as such.
Table 24 Confusion matrix for Nepali Data of MNN
| Predicted Class | |||
| Sample = 3,388 | Business | Not- Business | |
| Actual class | Business | 1784 (TP) | 1185 (FN) |
| Not- Business | 1604 (FP) | 2203 (TN) | |
Recall =0.59, Precision = 0.52, Accuracy = 0.58
F-Measure = 0.55 , where b = 1
5.2 Bar Chart Analysis of Result of Experiment
5.2.1 Nepali Dataset test with 20% of sample data for MNN with all 5 experiments

Figure 14 Bar chart for Nepali Data of MNN
Figure 14 illustrates the performance of the Multi-Neural Network (MNN) on a 20% subset of Nepali data in five different tests. Experiment 1 exhibited the greatest recall, albeit the lowest accuracy. Experiment 5, on the other hand, exhibited the highest level of accuracy and demonstrated satisfactory performance across the board.
When testing with a 20% sample of Nepali data in MNN, the experiment with the highest recall was experiment 1, whereas the experiment with the lowest recall was experiment 3. The lowest level of accuracy was observed in Experiment 1, while the highest level of accuracy was observed in Experiment 5. The performance evaluation parameter in experiment 5 is generally satisfactory.
5.2.2 Nepali Dataset test with 20% of sample data for RNN
Figure 15 Bar chart for Nepali Data of RNN
Figure 15 shows the performance of the Recurrent Neural Network (RNN) on a 20% sample of Nepali data across five experiments. Experiment 1 had the highest accuracy but the lowest recall, while experiment 3 had the highest recall but the lowest accuracy. Overall, experiment 3 showed satisfactory performance. Comparing the MNN and RNN, the RNN performed better with a maximum accuracy of 63%, compared to the MNN’s 48%.
When conducting tests on a 20% sample of Nepali data using RNN, the recall rate was found to be the lowest in experiment 1 and the greatest in experiment 3. The level of accuracy is the least in experiment 1 and the greatest in experiment 3. The performance evaluation parameter in experiment 3 is generally satisfactory.
After comparing the results of the MNN and RNN, it can be concluded that the RNN performs better than the MNN. The maximum accuracy attained by MNN is 48%, while the best accuracy achieved by RNN is 63%.
CHAPTER 6
DISCUSSION
6.1 Summary of Results
The objective of the study was to assess and contrast the effectiveness of Multilayer Neural Networks (MNN) and Recurrent Neural Networks (RNN) in the task of classifying Nepali news items based on their content. According to the results, the accuracy of RNN was superior to that of MNN. The Recurrent Neural Network (RNN) attained a peak accuracy of 63%, whilst the Multilayer Neural Network (MNN) reached a maximum accuracy of 48%. The findings indicate that RNNs have superior efficacy in the classification of Nepali news articles.
The study conducted a comparative comparison of the performance of Multilayer Neural Networks (MNN) and Recurrent Neural Networks (RNN) in the job of classifying Nepali news items based on their text content. The experimental findings suggest that Recurrent Neural Networks (RNNs) generally exhibited superior performance compared to Multilayer Neural Networks (MNNs) in terms of classification accuracy.
More precisely, Recurrent Neural Networks (RNNs) attained a peak accuracy of 63% throughout the studies, whereas Multilayer Neural Networks (MNNs) reached a maximum accuracy of 48%. The disparity in performance indicates that the sequential characteristic of RNNs, which enables them to preserve the memory of past inputs, is advantageous in capturing the contextual information found in Nepali news stories.
RNNs achieve improved accuracy due to their capacity to capture interdependencies among words in a sentence or document, a critical factor for comprehending the semantics and context of the text. On the other hand, Multilayer Neural Networks (MNNs), although efficient in understanding intricate patterns in data, may encounter difficulties in capturing distant connections in sequential data such as natural language text.
Nevertheless, it is crucial to acknowledge that the disparity in performance between RNNs and MNNs was not uniform throughout all the tests. There were occasions where Multilayer Neural Networks (MNNs) achieved comparable results to Recurrent Neural Networks (RNNs), suggesting that the decision between the two models may rely on the distinct attributes of the dataset and the classification task’s nature.
6.1.1 Effectiveness of RNNs and MNNs: To determine the effectiveness of Recurrent Neural Networks (RNNs) and Multi Neural Networks (MNNs) in categorizing Nepali text documents, you would first need to train these models on a dataset of Nepali text documents. The dataset should be labeled with the corresponding categories or classes. After training, you would evaluate the models using a separate test dataset to measure their performance metrics such as accuracy, precision, recall, and F1-score. These metrics would indicate how well the models are able to classify Nepali text documents into their respective categories.
6.1.2 Impact of Hyperparameter Settings: Hyperparameters are parameters that are set before the learning process begins. They can significantly impact the performance of your neural network models. To study the impact of varying hyperparameter settings on the performance of RNNs and MNNs, you would conduct experiments where you systematically change one or more hyperparameters (e.g., learning rate, number of layers, batch size) while keeping other settings constant. By comparing the performance of the models with different hyperparameter settings, you can determine which settings result in the best performance for your specific task.
6.1.3 Comparison of Efficiency and Accuracy: Efficiency and accuracy are two important factors to consider when evaluating neural network models. Efficiency refers to how quickly and with how much computational resources the models can process data and make predictions. Accuracy, on the other hand, refers to how well the models can correctly classify data. To compare the efficiency and accuracy of RNNs and MNNs for document classification, you would measure the training time, memory usage, and computational resources required by each model, as well as their accuracy on a test dataset.
6.1.4 Challenges in Applying Deep Learning Algorithms: Applying deep learning algorithms, such as RNNs and MNNs, to Nepali text document classification can pose several challenges. These challenges may include the lack of labeled data in Nepali, the complexity of the Nepali language, and the need for domain adaptation. To address these challenges, you would need to explore techniques such as data augmentation, transfer learning, and adapting existing models to the specific characteristics of the Nepali language.
6.1.5 Performance Improvement Strategies: To improve the performance of RNNs and MNNs for Nepali text classification, you could experiment with different strategies. These may include using pre-trained embeddings, fine-tuning models on Nepali-specific datasets, or adjusting the architecture of the models to better suit the characteristics of the Nepali language.
6.1.6 Practical Implications: Discussing the practical implications of using RNNs and MNNs for real-world applications in Nepali text document classification involves considering factors such as scalability, interpretability, and deployment feasibility. Scalability refers to how well the models can handle large volumes of data. Interpretability refers to how easily the models’ predictions can be understood by humans. Deployment feasibility refers to how easily the models can be integrated into existing systems and workflows.
6.1.7 Handling Complexity of Nepali Language: The Nepali language, like many other languages, is complex and can pose challenges for natural language processing tasks. To understand how RNNs and MNNs handle the complexity of the Nepali language, you would need to analyze how well the models capture the nuances of Nepali morphology, syntax, and semantics. This may involve conducting linguistic analysis and error analysis to gain insights into the models’ performance.
In summary, the findings indicate that RNNs show potential as a method for classifying text documents in the Nepali language. However, additional study is necessary to investigate the most effective setups and structures of RNNs for this purpose. Furthermore, future research could explore the efficacy of alternative deep learning architectures, such as Convolutional Neural Networks (CNNs) or Transformer models, in contrast to RNNs and MNNs for the purpose of classifying Nepali text.
6.2 Practical/Theoretical/Managerial/Research Contribution
Practical Implications: The results have practical implications for the creation of text categorization systems for Nepali language material. Organizations and developers may opt to employ RNNs for enhanced precision in categorizing news items and other textual data in the Nepali language.
Theoretical Contribution: The research presented in this study makes a theoretical contribution to the field of deep learning and text categorization by showcasing the efficacy of Recurrent Neural Networks (RNNs) in the specific context of the Nepali language. It contributes to the existing knowledge on the utilization of deep learning methods in languages other than English.
Managerial Implications: Managers overseeing natural language processing projects should consider utilizing Recurrent Neural Networks (RNNs) for text classification tasks, particularly for languages that have restricted computing and linguistic resources.
Research Contribution: This study enhances the broader academic community’s understanding of the effectiveness of deep learning models in classifying Nepali literature. This contributes to the expanding collection of work on the utilization of deep learning in languages with limited resources.
6.3 Limitations
A constraint of this study is the accessibility of data. The study included only a subset of news stories from two categories due to the abundance of data that was accessible. This could restrict the applicability of the results to different news categories or domains. In addition, the study specifically examined a particular form of deep learning model known as RNN, without investigating alternative models or ensemble methods. These unexplored routes could be potential areas for future research. Regrettably, the work failed to tackle the matter of word embedding, a vital aspect in enhancing the precision of deep learning models for classifying Nepali text.
1. Restricted Data Selection: The study exclusively employed a subset of news articles from two specific categories (Business and Interview) in order to accommodate the larger volume of data available in these categories. The restricted assortment of news content in Nepali may not adequately encompass the range of diversity, which could impact the applicability of the findings to other news categories or domains.
2. Insufficient Variability in Textual Data: The chosen news items may not adequately encompass the range of Nepali language usage, writing styles, or subjects. The absence of variability in this dataset may affect the resilience of the models trained on it and their capacity to generalise to unfamiliar data.
3. Overfitting: There is a potential for the models to excessively fit the training data, particularly when working with a small dataset. This may result in exaggerated performance metrics on the test data and a limited capacity to apply the findings to fresh, unfamiliar data.
4. Model Complexity: The study specifically examined the performance of two types of neural networks (RNNs and MNNs) and did not investigate other models or ensemble approaches. The performance of various models can vary based on the characteristics of the data and the specific task at hand. Therefore, the results obtained may not be universally applicable to all types of deep learning models.
5. Word Embedding Limitations: The work failed to tackle the matter of word embedding, a critical aspect in enhancing the precision of deep learning models for Nepali text classification. The omission of word embedding in this study may have had an impact on the performance of the models, as word embedding aids in the comprehension of semantic links between words.
6. Limited Resources: The study was unable to investigate more sophisticated methods or larger datasets due to resource limitations. This constraint may have hindered the extent of examination and the capacity to derive more subtle inferences regarding the efficacy of the models.
7. External Factors: The performance of the models may be influenced by external factors such as shifts in news reporting styles, changes in language usage, or societal trends. The study did not consider these characteristics, which could affect the generalizability of the findings.
8. computer Resources: The study’s scope may have been restricted by the available computer resources, thereby impacting the dataset’s size, the complexity of the models examined, and the depth of analysis performed.
6.4 Benefits
Nepali Text Document Classification using Deep Neural Networks has the potential to provide advantages to multiple stakeholders:
1. Scholars: This study offers valuable insights into the utilisation of advanced deep learning techniques such as Recurrent Neural Networks (RNNs) and Multilayer Neural Networks (MNNs) for the purpose of classifying Nepali text. This research contributes to the existing academic knowledge in this field.
2. Developers and Data Scientists: Professionals involved in natural language processing (NLP) and machine learning (ML) projects can utilise the discoveries to enhance their models and methodologies, particularly when working with Nepali or comparable languages.
3. Educational Institutions: Universities and colleges can utilise this thesis as a case study or reference material in their courses pertaining to Artificial Intelligence (AI), Machine Learning (ML), and Natural Language Processing (NLP).
4. Businesses: Enterprises engaged in content management, automated customer service, or information retrieval can employ the approaches and discoveries to improve the efficiency of their systems in processing Nepali text.
5. Government and NGOs: Government and non-governmental organisations (NGOs) might utilise the research findings to enhance their capabilities in document management, information distribution, and automated analysis of extensive Nepali text data.
6. Language Enthusiasts and Linguists: Those with a keen interest in computational linguistics and the digital processing of the Nepali language can get significant insights and practical applications from this research.
CHAPTER 7
CONCLUSION AND RECOMMENDATION
7.1 Conclusion
Text document classification was performed using recurrent neural networks (RNN) and multilayer neural networks (MNN). The performance of the classifier is evaluated using Nepali News Text Data. The experimental findings demonstrated that the accuracy of the Recurrent Neural Network (RNN) surpassed that of the Multilayer Neural Network (MNN). A Nepali data set test was conducted on a 20% sample of test data, which revealed a minor discrepancy in accuracy between the two neural network models. The maximum accuracy achieved by the MNN model was 48%, whereas the RNN model achieved a maximum accuracy of 63%. The minimum accuracy achieved by the MNN model was 5.7%, whereas the RNN model achieved a minimum accuracy of 59%.
The Nepali data set test sample failed to obtain high accuracy in RNN and MNN due to the issue of word embedding.
7.2 Recommendation
In order for the neural network model to train well, it is essential to have a substantial amount of data for collection. The Nepali data collection suffers from a lack of precision due to issues with word embedding. The absence of appropriate stemming and lemmatization techniques in the Nepali dataset results in the neural network model’s inability to attain a high level of accuracy. An appropriate library should be implemented to support word embedding for Nepali data.
REFERENCES
[1] P. David, A. K. Mackworth, and R. Goebel, “Computational Intelligence and Knowledge 1.1 What Is Computational Intelligence?,” Comput. Intell. A Log. Approach, no. Ci, pp. 1–22, 1998.
[2] G. Brewka, Artificial intelligence—a modern approach by Stuart Russell and Peter Norvig, Prentice Hall. Series in Artificial Intelligence, Englewood Cliffs, NJ., vol. 11, no. 01. 2009.
[3] A. L. Samuel, “Some Studies in Machine Learning Using the Game of Checkers Some Studies in Machine Learning Using the Game of Checkers,” IBM J., vol. 3, no. 3, pp. 535–554, 1969.
[4] J. Schmidhuber, “Deep Learning in neural networks: An overview,” Neural Networks, vol. 61, pp. 85–117, 2015.
[5] D. Ciregan, U. Meier, and J. Schmidhuber, “Multi-column deep neural networks for image classification,” Proc. IEEE Comput. Soc. Conf. Comput. Vis. Pattern Recognit., pp. 3642–3649, 2012.
[6] D. Y. Li Deng, “Deep Learning Methods and Applications,” Found. Trends Signal Process., pp. 199–200, 2013.
[7] M. van Gerven and S. Bohte, “Artificial Neural Networks as Models of Neural Information Processing,” Front. Res. Top., pp. 1–2, 2017.
[8] H. Sak, A. Senior, and F. Beaufays, “Long Short-Term Memory Recurrent Neural Network Architecturesfor Large Scale Acoustic Modeling,” 2018.
[9] G. Fei and B. Liu, “Social Media Text Classification under Negative Covariate Shift,” no. September, pp. 2347–2356, 2015.
[10] M. Popescu, L. persescu Popescu, V. E. Balas, and N. Mastorakis, “Multilayer Perceptron and Neural Networks,” vol. 8, no. 7, p. 579, 2009.
[11] G. E. Hinton, “(n.d.) Vinod Nair, Georffrey E. Hinton, Rectified Linear Units Improve Restricted Boltzmann Machines,” no. 3.
[12] Z. Zhang and M. R. Sabuncu, “Generalized Cross Entropy Loss for Training Deep Neural Networks with Noisy Labels,” no. NeurIPS, 2018.
[13] S. Ruder, “An overview of gradient descent optimization algorithms,” pp. 1–14, 2016.
[14] D. E. Rumelhart, G. E. Hinton, and W. J. Ronald, LEARNING INTERNAL REPRESENTATIONS BY ERROR PROPAGATION, no. V. 1985.
[15] W. S. Mcculloch and W. Pitts, “A logical calculus nervous activity*,” vol. 52, no. l, pp. 99–115, 1990.
[16] P. J. Werbos, “BEYOND REGRESSION NEW TOOLS FOR PREDICTION AND ANALYSIS IN THE BEHAVIORAL SCIENCES,” 1974.
[17] R. Dechter, “LEARNING WHILE SEARCHING IN CONSTRAINT-SATISFACTION- PROBLEMS*,” pp. 178–183, 1986.
[18] T. Joachims, “Introduction 2 Text Categorization 3 Support Vector Machines.”
[19] Y. Meng, J. Shen, C. Zhang, and J. Han, “Weakly-Supervised Neural Text Classification.”
[20] N. Kant, R. Puri, S. C. Ca, N. Yakovenko, B. Catanzaro, and S. C. Ca, “Practical Text
Classification With Large Pre-Trained Language Models.”
[21] Dechter, R. (1986). Learning While Searching in Constraint-Satisfaction Problems. University of California, Computer Science Department.
[22] Aizenberg, I., Aizenberg, N.N., & Vandewalle, J. (2000). Multi-Valued and Universal Binary Neurons: Theory, Learning and Applications. Kluwer Academic Publishers.
[23] Kant, N., Puri, R., Yakovenko, N., & Catanzaro, B. (2018). Practical Text Classification With Large Pre-Trained Language Models. Proceedings of the 2018 Conference on Empirical Methods in Natural Language Processing (EMNLP).
[24] Sak, H., Senior, A., & Beaufays, F. (2014). Long Short-Term Memory Recurrent Neural Network Architectures for Large Scale Acoustic Modelling. Proceedings of the Annual Conference of the International Speech Communication Association (INTERSPEECH).
[25] Meng, Y., Shen, J., Zhang, C., & Han, J. (2018). Weakly-Supervised Neural Text Classification. Proceedings of the 27th ACM International Conference on Information and Knowledge Management (CIKM).
APPENDIX

Figure 16 dataset sample from business category

Figure 17 dataset sample from interview category

Figure 18 preparation of dataset from text

Figure 19 python script to filter data set

Figure 20 python script to shape data set

Figure 21 python script to train model

Figure 22 gaant chart defining time spent in each step of the project

Figure 23 originality report 1

Figure 24 originality report 2

FC7W03NI Work Related Learning -INDIVIDUAL COURSEWORK


Acknowledgement
I would want to extend my heartfelt appreciation to each person who has provided suggestions, details, and support in any way.
I would also want to thank Mr. Rohit Pandey, our module leader, and Islington College for providing all thenecessary help and services. The timely completion of this project would not have been possible without their supervision and guidance.
Glossary and Abbreviations
| S. N | Title | Full Form |
| 1 | RUP | Rational Unified Process |
| 2 | DSDM | Dynamic System Development Method |
| 3 | SSADM | Structured Systems Analysis and Design Method |
| 4 | Prince2 | Projects IN Controlled Environments |
| 5 | SPSS | Statistical Package for the Social Sciences |
| 6 | SAS | Statistical Analysis System |
Table of Contents
- Introduction……………………………………………………………………………………………………………. 1
- Review of Activities………………………………………………………………………………………………… 4
2.1 Discuss the hierarchical framework of the company operations with the Supervisor. (L01) 4
2.2 Gather, understand, and interact with the data sources, as well as the different divisions that use the data. (L02) 4
2.5 Work on data analysis and visualization utilizing a variety of statistical methodologies in order to perform exploratory data analysis. (L05)………………………………………………………………………………… 6
2.6 Explain the exact results of the data analysis in your interpretation of the data. (L06) 7
- Show illustrations and inform the manager of your results. (L07)…………………… 7
- Academic Context……………………………………………………………………………………………….. 10
- Abilities Evaluation………………………………………………………………………………………………. 12
4.1 Discuss the hierarchical framework of the company operations with the Supervisor. (L01) 12
4.2 Gather, understand, and interact with the data sources, as well as the different divisions thatuse the data. (L02) 13
4.5 Work on data analysis and visualization utilizing a variety of statistical methodologies in order to perform exploratory data analysis. (L05)……………………………………………………………………………… 16
4.6 Explain the exact results of the data analysis in your interpretation of the data. (L06) 17
- Show illustrations and inform the manager of your results. (L07)…………………. 17
- Challenges…………………………………………………………………………………………………………… 19
- Conclusions…………………………………………………………………………………………………………. 22
- References………………………………………………………………………………………………………….. 24
- Appendix……………………………………………………………………………………………………………… 25
Table of Figures
Figure 1: Organizational Chart of Informatic computer hub…………………………………………… 2
Figure 2: Learning agreement 1………………………………………………………………………………….. 25
Figure 3: Learning agreement 2………………………………………………………………………………….. 26
Figure 4: Learning agreement 3………………………………………………………………………………….. 28
Figure 5: Internship completion letter………………………………………………………………………….. 29
Figure 6: CV……………………………………………………………………………………………………………….. 31
Figure 7: App of my job 1……………………………………………………………………………………………. 32
Figure 8: App of my Job 2…………………………………………………………………………………………… 33
Figure 9: Udemy class online of R………………………………………………………………………………. 34
Figure 10: Researched text………………………………………………………………………………………… 35
Figure 11: Udemy class online for python…………………………………………………………………… 36
Figure 12: Job interaction hub using slack………………………………………………………………….. 37
Figure 13: Work management method using trello……………………………………………………… 38
Figure 14: By using R studio, programming done (undisclosable)………………………………. 39
Figure 15: Analysis of various dataset t(undisclosable)………………………………………………. 40
Figure 16: Visualization of dataset (undisclosable)……………………………………………………… 41
Figure 17: Private group chat of team members…………………………………………………………. 42
Figure 18: Scandal related of Analytica in cambridge…………………………………………………. 43
Figure 19: scandal related of BJP Facebook………………………………………………………………. 44
Figure 20: right wing policies algorithm of the twitter…………………………………………………… 45
Figure 21: Response from the customers…………………………………………………………………… 46
1 Introduction
I currently work as a data analyst for the Informatic computer hub pvt. ltd IT division. As component of the Work-Related Learning program for my master’s degree, we have to finish at least of 45 working days of internship experience at an IT firm. I chose the Informatic computer hub pvt. ltd because it is a young ITcompany with clients all around Nepal and maintains a substantial amount of data, suggested by Mr. Rohit Pandey, the course leader.
My mentors in data analysis and visualization were Mr. Rakesh Kandel head of business intelligence, and Mr. Sandesh Lamsal, our department supervisor.
The beginning and end dates of my internship were February 20 and April 03, respectively. During working on my internship, I analyzed and visualized the datasets using the techniques I had previously learned in my studies.
1.1 Placement background
Informatic computer hub pvt ltd, a company situated in Samakhushi, was established in 2016. On MST, you can read your own comments and access digital books from any gadget, compete against friends in kahoot competitions, take part in live online classes with the instructors from your educational institution, and eveninteract socially with other individuals while studying through engaging and informative videos. In otherwords, every educational task might be done digitally in an educational organization that makes use of an online learning technology.
The company collaborates with local media for conducting business around the country. We provide IP an infrastructure for hosting electronic books. The company also creates its own educational movies at itsfacility using already existing curricula. We have actors, content creators, and screenwriters for any topic at all stages. We additionally have a team for animation, one for development, one for quality assurance and manufacturing control, one for ingestion, one for sales and advertising, and more.
1.2 Structure and role of the company
There are many units of the Informatic computer hub, and each one employs 3-5 people. In all, there areabout 20 employees. During my time as an intern, I worked as a data
analyst for the company. We were in charge of all platform analytics. The organization chart for the business is shown in the image below.

Figure 1: Organizational Chart of Informatic computer hub
1.3 Department where I worked
I worked as a data analyst in the company. It was my duty as a data analyst to make sure that all system data was displayed on the visualization dashboard in our back office. I realized that I also needed to modifythe dashboard statistics to reflect the new corporate milestones and commercial partnerships. We regularly choose more recent infographics with the ability to present data with several dimensions or variables. We switched from single-variate to multiple-variate evaluation in this way. There were around 4 individuals in our unit, but we also worked closely with other departments.
2 Review of Activities
As a part of the company, my responsibilities were gathering, cleaning, analyzing, interpreting, visualizing,and receiving user feedback on the data. We engage with other publications in order to gather data via Slacks as well as conventional means since product partners with several publications around the country and hosts their eBooks.
We followed the Scrum guidelines and worked in iterations, using Trello to maintain track of our progress. I was successful in achieving all of my objectives for data analysis and visualization throughout my internship. I’ve compiled my learning goals below, which I utilized to accomplish every internship goal.
2.1 Discuss the hierarchical framework of the company operations with the Supervisor. (L01)
Throughout the initial week of the internship, my supervisor and I discussed the broad duties that the team had as well as the hierarchical structures of the company’s operations. He explained my duties and how they’ll impact the project. He provided me with the account login information and explained how our business partners’ data is collected using tools like Dropbox and Google Drive.
The points of contact I would later learn were introduced to me at a virtual meeting that we conducted with other collaborators after a few days.
The Appendix contains evidence supporting this learning objective.
2.2 Gather, understand, and interact with the data sources, as well as the different divisions that use the data. (L02)
The next week during my internship, I requested access to the dataset documents from my mentor. He gave me access to my business account but cautioned me to treat the data carefully. We had a meeting to go through the project’s requirements and possible approaches after thoroughly evaluating the different datasets. I learned that my boss enjoys utilizing the R and Python programming languages for handling the data and the Scrum project management methodology to complete the projects. Slacks was used mostlyfor interaction, while Trello was used to keep track of how we were doing at work.
Instead of just following the standard procedures and practices utilized in my company, I decided to research the tools which were available and would prove most helpful for my project. As a data analyticsresearcher, I was unable to use the currently available SPSS and SAS applications. The best programminglanguages, in my view, were R and Python because they are widely used, open-sourced, and cost nothing. I chose to stick with Scrum because it was already well-known by most of the team members and since switching to a completely other strategy would take an enormous amount of time, energy, and resources. Similarly, I found that Slacks and Trello are better for the same aspects.
The Appendix contains evidence supporting this learning objective.
2.3 Evaluate numerous R and Python-based data analysis programs. (L03)
I had previously acquired a fundamental grasp of both R and Python since I completed modules in both languages as a component of my master’s program. The WRL component gives me the ability to go evenmore into them. I registered with R and Python classes on Coursera and Lynda.com. The books “The Art of R Programming” were utilized by me at this time.
Upon gathering all the relevant datasets, I used Python to combine and merge them into a single file for further study. Every time our team gets out to collect data, multiple datasets must first be combined into onedata set. This is the reason integrating datasets is necessary.
Due to unused repeats and parts, the merged dataset needed to be cleaned. I was able to import, read,and clean CSV files due to my prior Python knowledge in “Programming for Data Analysis”.
2.4 Communication, leadership and cooperation (L04)
The fourth week of my internship focused on soft skills. It is widely agreed upon how technical abilities will aid in your employment whereas soft skills will aid in your advancement. Since serving professionally forthree years, I can discuss the importance of soft skills in the workplace through my personal point of view. I can still clearly remember being nervous on my very first day of work because I didn’t know how the business was operated or who to question. But with time, I was able to acquire all the essential expertise and overcome every challenge.
When I was an intern, our team included four members. Thus, before starting the data analysis andvisualization assignment, we had a conversation and decided on the duties for every worker. Following theScrum approach, we created user stories, gave each one a story point value, and specified a deadline forcompletion. Then, we submitted the user stories to the project management tool Trello so that we couldtrack our advancement. In our team, we carried out the chores in this way.
2.5 Work on data analysis and visualization utilizing a variety of statistical methodologies in order to perform exploratory data analysis. (L05)
During the fifth week of my internship, I kept using Python to review and assess data. Data analysis uses mathematics, statistics, and probabilities. I thoroughly examined the dataset to determine its precise format.The K-Nearest Neighbor approach, Naive Bayes, Logistic regression, and Linear regression were allrendered more accessible as a result. Since the datasets I used needed binary classification, I used logistic regression.
I have to do a lot of research to meet my learning goal. I continued the R and Python courses on Courseraand Lynda which I had already signed up for. I was also able to read more of the “Learn Python the Hard Way” textbooks. Because doing the study was so challenging, I needed to set aside a significant amount of time.
2.6 Explain the exact results of the data analysis in your interpretation of the data. (L06)
I utilized Python throughout the sixth week of my employment to instantly apply the earlier techniques I hadlearned to data. Whenever a user visits our website, creates an account, and subscribes to our materials,their information is saved in the database of our server. My primary goal was to write an algorithm toanalyze this data and display it on the back office. I did this over many datasets using a variety of tools andmethods. The dashboard of the back office was then updated with this data. We have to conduct a great deal of testing to confirm it.
To achieve this learning aim, we had to be in touch both the front end and back-end groups constantly. It was really stressful because the other groups were already busy with different tasks. However, it took me a few trials before I was able to display the needed data accurately.
2.7 Show illustrations and inform the manager of your results. (L07)
In the seventh week of my internship, I utilized R to make graphical illustrations of the data analysis results. The various advanced packages and tools that are previously bundled with R, such as ggplot2, Dplyr, Plotly, and others, significantly increase the complexity and attractiveness of these visualizations. Ggplot2 is the abbreviation for Grammar of Graphics.
I learned that Python is a tool that is commonly used in data science processes and it is particularly suggested for machine learning. This is why I used Python for data analysis but R for data visualization. Using the aforementioned tools and libraries, I was able to accurately show line diagrams, bar graphs, bar charts, histograms, scatter plots, pie charts, and boxplots. I then used the same approach and technique fordisplaying on the dashboard of the back-office.
2.8 Plan and participate in educational events. (L08)
In an effort to gather experience, I requested that my boss schedule sessions with various organizationsthroughout the eighth week of my employment. Fortunately, my supervisor informed us that the head of a marketing and sales staff required training within a few days.
After some preparation, I offered the Sales Head—one of the most genuine persons I’ve yet met—accessto the system’s online training. The old man shared his knowledge with me and opened my eyes to newideas. He would go above and above what was required to inspire the program on his end. Considering the fact that I was the one giving him instructions, I improved my ability to communicate and interact with others. He informed me that he had sent a six-month notification of his decision to retire to his formercompany. Moreover, he described to me how his extensive network and business experience from a long career had given him the opportunity to negotiate for greater salary and contracts in his new firm, which he had founded.
2.9 Understanding the social, legal, and professional facets of the company(L09)
During my ninth week as an intern, I conducted research to understand how data management may impact the firm in terms of the law, society, ethics, and work environment. I learned that European IT companieswho fail to safeguard the data of their customers are subject to penalties and legal action by the General Data Protection Regulation (GDPR), a government agency.
In terms of social effects, I learned that Cambridge Analytica had a big impact on Facebook, which is now known as Meta. After that, Meta allowed third-party apps to acquire user data without the users’ consent inorder to generate money. The knowledge was then used to disadvantage the Republican party and influencethe result in their favor during the 2016 US presidential election. A hefty fine was imposed on Meta.
Russia is also suspected of meddling in the presidential election by operating a variety of social media campaigns to support the Republican Party and discredit the Democratic Party.
2.10 Gather consumer feedback and thoughts(L010)
I took a conscious decision to understand how to gather customer feedback and integrate that information into planned updates during the tenth week of my employment. In order to be user-centric and learn fromcustomer feedback, it is crucial for all enterprises to pay close attention whenever we are interacting withcustomers. As a consequence, there will be moments when we have to put our egos aside for the good of the company and ask for their input to ensure that they are happy.
3 Academic Context
Individuals get the ability to work as data analysts and gain experience in the field through a job-related learning module. This gives the students exposure to a wide range of subjects and gives them the chance to develop practical data management skills. I was extremely ready to begin this experience on my own since I felt it would be worthwhile.
I was fortunate to have lecturers and mentors who were accomplished authorities in their respectivedisciplines. The knowledge and experiences they shared sparked my attention and helped me realize how my own career in data analytics is likely to go. When I was conducting my internship, I distinctly remember reflecting on and contrasting the classroom situations.
3.1 Software Project Management
The emphasis of this subject was still on project management within the context of software development. I employed the Scrum methodology during my internship due to its progressive and customizable nature. Agile concepts form the foundation of Scrum. To outline my ideas, I used planning instruments like an PERTchart and the Gantt chart. Working with my peers, I assessed hazards and developed backup strategies. Iused the COCOMO framework together with the pricing, cash flow, labor estimation, and NVM concepts for the financial evaluation.
I ran tests on issues related to team administration, including daily operations, assigning tasks, and leadership philosophies. During my discussion with CEOs, I expressed my views on recruiting and legalissues, including privacy of data, equality, agreements, and employment possibilities. Along with social issues like secrecy and how they affect the work’s bottom line, we also discussed professional and ethicalissues such the BCS rules of action.
3.2 Cyber Security Management
In this course, we discovered the importance of overseeing digital safety in the modern business setting. I was conscious that the perpetrators were constantly developing cutting-edge tactics, techniques, and procedures (TTPs) for participating with economic espionage and defamation. So, as a data analyst, I talked about the importance of managing information security in addition to its many forms, techniques, ideas, and characteristics with my bosses (InfoSec Communities). I continuously made connections between my actions and methods for determining and assessing risks, like weighted factor analysis, a TVA worksheet, and their results, during the course of my internship.
We discussed how to recognize risks in a business and how to use a variety of approaches to reduce them to a manageable level. The forms, methodologies, components, prerequisites, and phases of a security ofinformation policy, including rules, standards, and procedures, were also discussed. This contains the digital death chain and Mitre Att&ck ideas. During a lecture we gave the group, I discussed my views on cybersecurity audits and related ethical, legal, and commercial challenges. Additionally, they gave me details on relevant security guidelines.
3.3 Programming for Data Analytics
This course helped us set the foundation for strong programming principles by introducing Python application programming for data analytics. We covered a variety of subjects, including input and output of data, flow controls, handling mistakes, and programming data structures. Throughout my internship, I found the information processing and visualization tools I learned in this session to be of utmost use. With the help of both the NumPy and pandas frameworks, I was able to modify data. Using the matplotlib and seaborn libraries, I also produced graphics like histograms and bar charts, box charts, etc. These extensions are highly powerful and are utilized in both academic and professional settings.
The primary concepts we learned in the course, including as patterns, looping, searching, arranging, aggregating, classification, association, linear regression, and matrix operations, were essential for doingdata analysis. Python is the most often used tool for analyzing data, therefore learning its essential concepts in this program has helped me improve my fundamental coding.
3.4 Data Warehousing and Big Data
This topic discussed database principles and systems for managing them in connection to the development of modern enterprise-level databases. In addition to other Big Data technologies, we learned about Hadooparchitectures, data intake, transformation of data, and data management. While working on data projects and during job interviews, the information we acquired about SQL queries proved useful. In this course, I learned how to manipulate data and obtain useful information using Oracle, PostgreSQL, and SQL Server.
In addition, we worked with a range of technologies—including Hadoop, HDFS, MapReduce, Spark,Sqoop, Hive, Pig, and MLlib—in several case studies and gained a
lot of knowledge through practical exercises. I know how to use the big data system ecosystem to put myknowledge regarding the way to evaluate big data to use, while I am conscious of way the data is utilized atdifferent levels. I am aware of both the advantages and disadvantages of technology. Along with that, I’ve learned how to leverage data to spark innovation and boost organizational effectiveness. In this way, this training gave me new perspective on the work I do as a data analyst.
4 Abilities Evaluation
4.1 Discuss the hierarchical framework of the company operations with the Supervisor. (L01)
I met with my supervisor as part of the initial learning objective of my internship, and we discussed thebroad duties assigned to the team as well as the hierarchical framework of the company’s operations. Heexplained my duties and how they’ll impact the project. He provided me with the login details and explainedhow our partners’ data is collected using tools like Skydrive and Google Drive.
The persons I would be routinely speaking with were introduced to me during a virtual conference we conducted a few days later, as I later learned. It was challenging to work with different groups and accents, yet it was also fascinating to listen to whatever each person had to say regarding the various subjects.
I was able to effectively complete my first learning goal by collaborating with my supervisor, colleagues, andthe manager of human resources to gather the pertinent data, get the requirements, and finally use those datasets to create a project plan.
The Appendix contains evidence supporting this learning objective.
4.2 Gather, understand, and interact with the data sources, as well as the different divisions that use the data. (L02)
My second learning objective for the internship was to approach my boss for authorization to access thedataset files. He gave me access to my business account but cautioned me to treat the data carefully. We held a conference to discuss the project’s requirements and potential solutions after thoroughly evaluatingthe various datasets. I learned that my boss enjoys utilizing the R and Python tools to handle the data and the Scrum methodology to complete the assignments. Slacks was used mostly for communication, while Trello was used to keep track of how we were doing at work.
Instead of just following the established methods and practices utilized in my firm, I decided to performresearch on the tools that were available and would prove most helpful for my project. I’d been unwilling toutilize pre-built SPSS and SAS applications as Power BI and Tableau since I was learning data analytics. Inmy perspective, R and Python are the best programming languages since they are widely used, open-sourced, and affordable. I chose to stick with Scrum since it was already being used by most of the staff at the organization and because switching to a whole new strategy would take a lot of time, energy, and resources. I also learned that Slacks and Trello were better.
I achieved my second learning goal by collaborating with my boss to get datasets, studying and choosing R and Python, the Scrum methodology, Slacks, and Trello being the most effective tools for the task. To findout more regarding how they handle the data, I also chatted with the Ingestion team.
Evidence in support of this learning aim may be found in the Appendix.
4.3 Evaluate numerous R and Python-based data analysis programs. (L03)
I already knew the fundamentals of R and Python because I attended classes in both throughout my master’s program. The WRL component gives me the ability to delve further into them. I registered for R andPython courses on Udemy and Lynda.com. During this time, I also used the texts from “The Art of R Programming”. After gathering all the relevant datasets, I used Python to combine and integrate them into asingle file for further study. When our organization sets out to collect data, integrating datasets is necessary since data from many sources must first be combined into one dataset.
The merged dataset needed to be cleaned up because it had unused portions and repeats. I was able toload, read, and clean CSV files thanks to my prior Python expertise on “Programming for Data Analysis”.Parallel to this, I combined data using SQL queries utilizing the various join techniques I learned on in the Big Data and Data Warehousing course. Using built-in procedures and processes, I cleansed the data. The process of importing, reading, cleaning, and integrating databases is known as data wrangling.
The third learning objective was effectively accomplished through research using different data analysis techniques and information wrangling on the merged dataset to conduct more data analysis.
4.4 Communication, leadership and cooperation (L04)
The fourth learning goal of my internship was to develop soft skills. It is widely agreed upon that technical skills will aid in your employment whereas soft skills will aid in your advancement. After working in aprofessional capacity for three years, I am able to speak from experience on the importance on soft skills in the workplace. I can still clearly remember being nervous upon my inaugural day at work since I didn’t know how the business was operated or who to question. However, in a period of time I became able to learn what I needed to know and overcome every challenge.
I learned how important it is to create a friendly atmosphere where everyone can express themselves freely.I came to the conclusion that a tight work environment kills innovation and originality because the fearful employee is always worried about not offending the management. To build our confidence in light of this, wetook great care and spoke about negotiation, emphatic listening, public speaking, and working ethics.
The fourth learning aim was accomplished by focusing on soft skills including team management, leadership, and interpersonal connection.
4.5 Work on data analysis and visualization utilizing a variety of statistical methodologies in order to perform exploratory data analysis. (L05)
The sixth learning goal of my internship was to comprehend and assess data using Python. Data analysis uses mathematics, statistics, and probability. I thoroughly examined the dataset to determine its precise format. This helped me decide between the naive Bayesian Logistic Regression, Linear Regression, and K-Nearest Neighbor technique. Since each data set I utilized required binary classification, I used logistic regression.
However, I was able to learn a few fundamental data analysis techniques that may be used to solve real-world problems. Despite all the challenges, I was able to examine the data and accomplish all of my goalsowing to the supervisor’s strong encouragement and some helpful comments.
I achieved my fifth learning target in this way, utilizing the logistic regression method on Python with the assistance of my supervisor.
4.6 Explain the exact results of the data analysis in your interpretation of the data. (L06)
For the sixth learning outcome of my internship, I utilized Python to combine the prior methodologies I had learned into real-time data. When a person visits our website, creates an account, or subscribes to our materials, the data they supply is saved in our database. My primary goal was to write an algorithm to evaluate this data and display it on the back office. I did this using a variety of packages and methods onseveral datasets. The back-office dashboard was then updated with this data. We have to perform plenty of checks to verify it.
To achieve this learning aim, we needed to be in touch with both the front and back end teams constantly. It was fairly intense because the other groups were preoccupied with other tasks. However, it took me a few trials before I was able to display the needed data accurately. Later, I enhanced the algorithm with the help ofmy supervisor to make it more precise and accurate.
This is how I met my sixth learning goal: I created a number of algorithms and displayed their details on the dashboard.
4.7 Show illustrations and inform the manager of your results. (L07)
For the seventh learning objective of my internship, I utilized R to generate graphical displays of the results of the data analysis. The many advanced libraries and tools that are already built into R, such ggplot2,Dplyr, Plotly, and many more, greatly increase the complexity and appeal of our charts.
My research led me to the conclusion that Python is a tool that is often employed in data science processes and is best suited for machine learning. This is the reason I chose Python for data analysis but R for datavisualization. Using the aforementioned tools and libraries, I was able to accurately show graphs of lines, bargraphs, bar charts, histograms and scatter plots, pie diagrams, and boxplots. After that, I used the same approach and technique to show on the dashboard of our back-office. The results seemed to impress my management.
It was actually one of my first projects utilizing Python and R, so I’m conscious that I still have a lot to learnand research. In the near future, I aim to conduct study in each of those topics.
I used a variety of complex R tools and real-time graph visualization to accomplish my seventh learning target.
4.8 Plan and participate in educational events. (L08)
As the ninth learning objective of the internship, I requested my boss if he could set up discussions with other groups so I could obtain some experience. Fortunately, my supervisor informed us that the head of the sales and marketing department needed training after a few days.
I also got the opportunity to teach a marketing group. They were a group of 4 young individuals that worked together. The training plans created by the young group have a strange quality. They dedicate a lot of additional effort, but they may also be critical and impatient at times. I concentrated on educating them onbetter data collection techniques through a data analyst’s perspective. We talked extensively about their company procedures and labor issues.
I achieved my eight learning objectives by organizing a lesson in which I got the chance to speak withpeople from all walks of life regarding our operational approach and way of life.
4.9 Understanding the social, legal, and professional facets of the company(L09)
On the ninth learning objective of the internship, I did research to understand how utilizing data can have implications for the company in regard to the law, society, morality, and the workplace. I learned that European IT companies who fail to safeguard the data of their customers are subject to penalties and legal action by the General Data Protection Regulation (GDPR), a government agency.
Additionally, it’s believed that Russia meddled in the election for president by operating a variety of social media campaigns to undermine the Democratic Party and support the Republican Party online. Additionally, there were speculations claiming the Indian government (the BJP) was prepared to reduce Facebook’s taxes in exchange for Facebook charging less for promoting the BJP’s propaganda video than its rival organizations. All of these circumstances raise significant “ethical” and “professional” questions, as well asthe impact that influential media companies have on the democratic foundation of elections. These subjects need to be discussed more.
I was able to complete my ninth learning objective by researching the possible legal in nature, ethical, social, and professional ramifications associated with a data breach or data misuse.
4.1 Gather consumer feedback and thoughts(L010)
My internship’s tenth and last learning objective was to figure out how to get client feedback and incorporate it into subsequent enhancements. Every business is built on becoming client-centric and learning from customer feedback, therefore while we are working with customers, we must constantly be on guard. As a consequence, there will be moments when we have to put our egos aside for the good of the company and ask for their input to ensure that they are happy. In this way, I met my ninth learning goal.
5 Challenges
Being a data analyst for the first time made it challenging in a variety of ways. I encountered obstacles throughout the course of the project on the technical skills, relationships, as well as some forced fronts. Despite these difficulties, I was still able to develop my essential data analysis skills and broaden myexperience. Thanks to the help
I had with my supervisor and my classmates, I was able to complete the project on time, and I’m quite happy and satisfied about that. I’ve emphasized the three challenges that were the most challenging for me to overcome.
5.1 Management of Time
Time management was quite challenging for me since I had to juggle a full-time job with my college schoolwork. I struggled to balance this assignment’s research requirements with the assignments for my other classes. I had already finished the WRL curriculum during my undergraduate studies, so in a way Iknew what to expect. As a consequence, I prepared ahead of time. At this period, catching up withcoworkers and going on outings were discouraged.
In the end, I changed my goals and schedule. I learned something new every day, and soon things began to make sense. I learned how to deal with uncertainty and advance. This allowed me to develop importanttime management skills, and I am confident in my capacity to do so in the future.
5.2 Development skills and Data Analysis
Prior to this internship, my knowledge in the use of R and Python for data analysis and development was limited to what I had acquired in my education. I lacked any project- specific knowledge. I struggled to get my work going. I had to devote a lot of time in research, which helped me hone my data analysis skills. By enrolling in online courses on Coursera and Udemy, I did research. Since they are more in-depth, I also read a few books. I also spoke with my management and my coworkers to seek their suggestions. I ultimately developed strong data analysis and creation skills and was able to complete the work at hand.
5.3 Communication
I discovered throughout my internship that everyone has their own limitations, making effective engagement challenging. I learned that we need to be more attentive and understand everyone’s psychological intelligence so as to communicate effectively. Alternately, there is always a possibility ofmiscommunication, which might be detrimental to the work at hand.
We used advanced job-planning programs like Trello and business communication systems like Slack, but we still had a lot of trouble interacting with other departments. I reached the decision that talking things outin person was the best course of action. I also learned that speaking discreetly entails paying close attention, making allowances, and having a growth mindset. I had the good fortune to increase my communication skills in this way.
6 Conclusions
During my internship, I was aware of how unprepared I had been for the real world of work. I understood that if I wanted to grow, I had to overcome my habit of staying in my comfortable surroundings, put in a lot ofeffort, grow more independent, and be proactive.
During the debate with my elders, I learned that competitive organizations use psychological tests to evaluate beliefs, attitudes, past experiences, our upbringing, and other elements. Some people are devout, socially conscious, economically motivated, etc. by nature. This is done to lessen the risks associated with recruiting or advocating. While the work experience proved far from a psychological evaluation, I am now more certain that my cognitive abilities are on level with those of others in the industry and that I feel no better than anyone.
I am eager to use the teamwork, organization of time, analysis of data, and graphical presentation abilities I have gained to my next responsibilities. I was able to find some fantastic materials with the assistance ofmy supervisor. I was able to go on with my data analytics project thanks to the assistance of the job-relatededucation component. In this way, the internship gave me the chance to put my strength to the test by diving to the bottom of the deepest ocean. I’m eager to investigate the fresh possibilities that lie ahead.
6.1 Future Plan
I had already finished a preliminary project for the course in Python on programming for analytics in data that involved analyzing data and visualization. To analyze and display the information contained in this WRLcomponent, I utilized R and Python. I still have one more project to do for the Analysis of Data and Visualization section. Finally, I want to develop a spectacular project on the report from the previoussemester for my course. As soon as my last year is through, I plan to change jobs and apply for the position of data scientist using the work mentioned above as a résumé. I want to apply both the hard skills and soft skills I’ve acquired. I’m overjoyed that the perfect scenario I had pictured prior participating in a graduate degree is approaching.
7. References
Restori, M., no date. What is Exploratory Data Analysis. [Online] Available at: https://chartio.com/learn/data-analytics/what-is-exploratory-data-analysis/ [Accessed 7 1
2022].
8. Appendix
8.1 WRL Form

Figure 2: Learning agreement 1

Figure 3: Learning agreement 2


Figure 4: Learning agreement 3
8.3 Internship Completion Letter

Figure 5: Internship completion letter
8.4
CV

8.5 Evidence
8.5.1 Evidence of L01

Figure 7: App of my job 1

8.5.2 Evidence of L02

Figure 9: Udemy class online of R

8.5.3 Evidence of L03

Figure 11: Udemy class online for python
8.5.4 Evidence of L04

Figure 12: Job interaction hub using slack

Figure 13: Work management method using trello
8.5.5 Evidence of L05

Figure 14: By using R studio, programming done (undisclosable)
8.5.6 Evidence of L06

Figure 15: Analysis of various dataset t(undisclosable)
8.5.7 Evidence of L07

Figure 16: Visualization of dataset (undisclosable)
8.5.8 Evidence of L08

Figure 17: Private group chat of team members
8.5.9 Evidence of L09

Figure 18: Scandal related of Analytica in cambridge

Figure 19: scandal related of BJP Facebook

Figure 20: right wing policies algorithm of the twitter
8.5.10 Evidence of L010

Figure 21: Response from the customers

CC7183NI Data Analysis and Visualization – INDIVIDUAL COURSEWORK


Abstract
The purpose of the research is to forecast salaries in the United States for positions like data scientist, data engineer, data analyst, machine learning engineer, and others. A number of variables are included in the dataset, including job title, organization rating, location, others. The process used to train the machine learning model to forecast the expected salaries for the roles is thoroughly described in the study. Mean squared error, mean absolute error, and R-squared were used to assess the trained model’s correctness.
The results of the investigation showed that, with an R-squared score of 0.9644, the RandomForestRegressor performed the best for predicting salary. The paper comes to the conclusion that machine learning techniques can be useful for forecasting industry salaries.
Table of Contents
Feature Engineering Justification
Data Preparation for Model Training
Evaluation with Visuals & Cross-Validation
Table of Abbreviations
| Abbreviated Word | Full Form |
| MAE | Mean Absolute Error |
| MSE | Mean Square Error |
Introduction
The ability to estimate salaries is very important to both employees and employers across a range of industries. Employees are curious about the worth of their work and how it stacks up against other professions. Predictive models for pay prediction have gained popularity as data-driven business practices spread across industries. Results relating to job title and location can be accurately provided by data-driven approaches.
This report’s objectives are to examine numerous contributing elements for salary prediction models and assess the efficacy of various common machine learning algorithms. We will also go over the value of feature engineering in creating powerful models.
By the report’s conclusion, the reader will be able to comprehend how state-based pay projection is carried out as well as the details of the variables affecting the changes.
Problem Statement
Accurate salary prediction is an essential responsibility for companies and job seekers alike. Companies need accurate data to provide competitive pay, while job seekers want to know the market value of their expertise and talents. Conventional techniques for estimating salaries frequently depend on static market reports or small-scale surveys, which might not account for the dynamic shifts in the labour market.
The goal of this project is to create a machine learning model that can forecast wages for data-related positions in the US based on a variety of variables, including job title, necessary skills, company characteristics, and location. The project’s goal is to develop a trustworthy wage estimating system that can direct organisational planning and career selections by examining these variables.
Background
In recent years, machine learning-based salary prediction has drawn more attention. Numerous studies demonstrate how regression-based models, like Linear Regression, can provide a straightforward correlation between wage outcomes and work characteristics (Sklearn, 2023). It has been demonstrated that more intricate models, such as Random Forest Regressors and Decision Tree Regressors, can better forecast salaries by capturing non-linear correlations between variables (Menon, 2023). Additionally, studies show that the predictive performance of machine learning models for compensation analysis is enhanced by integrating feature engineering, which includes taking into account company characteristics (size, industry, and revenue) and extracting skills from job descriptions (e.g., Python, AWS, Spark) (D’Agostino, 2023).
Aim and Objective
Aim:
Data analysis and the creation of a machine-learning model are the project’s key objectives. The project’s main goal is to analyze data and create a machine-learning model.
Objectives:
- To analyze all data
- To prepare all the data
- To determine the relationship between different components.
- To develop a salary prediction system
Project Workflow
Data Collection
The web application Glassdoor was used and the data was downloaded. Downloaded data, which contains more collect data, is pulling data from web sites and preserving it in a structured way. Using the search term “data scientist” within the United States of America, the technique comprises data from the search results page.
Data Understanding
The gathered data is presented as a CSV file with 956 rows and 15 columns. The dataset has no missing values.
Integer, float, and text are the three datatypes that make up the Dataset. The attributes in the dataset are as follows:
| Column / Attributes | Description | Data Type | Variable Type |
| Unnamed | S.N of the rows | non-nullint64 | Discrete |
| Job Title | The posted job title | non-nullobject | Discrete |
| Salary Estimate | Estimated salary provided | non-nullobject | Discrete |
| Job Description | The description about the posted job | non-nullobject | Discrete |
| Rating | Rating of the organization that posted the job | non-nullfloat64 | Discrete |
| Company Name | Name of the organization | non-nullobject | Discrete |
| Location | The location to work at | non-nullobject | Categorical |
| Headquarters | Headquarter location of organization | non-nullobject | Discrete |
| Size | The size of company based on employee count | non-nullobject | Categorical |
| Founded | Year organization was founded | non-nullint64 | Discrete |
| Type of ownership | What party owns the organization | non-nullobject | Categorical |
| Industry | The industry organization falls into | non-nullobject | Categorical |
| Sector | The sector organization falls into | non-nullobject | Categorical |
| Revenue | Revenue of the organization | non-nullobject | Categorical |
| competitors | The rivaling or similar organizations | non-nullobject | Discrete |
Data Cleaning
The dataset can be cleaned once we have a solid grasp of it, making the raw data available for further processing and analysis.
Two libraries will be sufficient to change the dataset into the desired dataset, therefore we will only need two libraries for data cleaning. Libraries include:
- Pandas
- Numpy
Importing the required libraries:

Reading the dataset:

A quick look at the dataset:

Looking at info of the dataset:

Looking at the size of the dataset:

Removing the rows where ‘Salary Estimate’ is -1 as they are equivalent to null values

Removing (Glassdoor est.) from ‘Salary Estimate’ and storing result into salary:

Removing K from ‘Salary Estimate’ and storing into salary_remove_K:

Creating new feature for if salary is based on per hour basis:

Creating new feature for if salary is provided by employer themselves:

Removing ‘per hour’ and ’employer provided salary:’ salary_remove_K and storing into salary_clean:

Creating new feature ‘salary_min’ for minimum salary based on salary_clean:

Creating new feature ‘salary_max’ for maximum salary based on salary_clean:

Creating new feature ‘salary_avg’ base on ‘salary_min’ and ‘salary_max’:

Checking compay names with ‘Rating’ -1.0:

Cleaning company name and storing it in new feature ‘company_txt’:

Looking at the new feature ‘company_txt’:
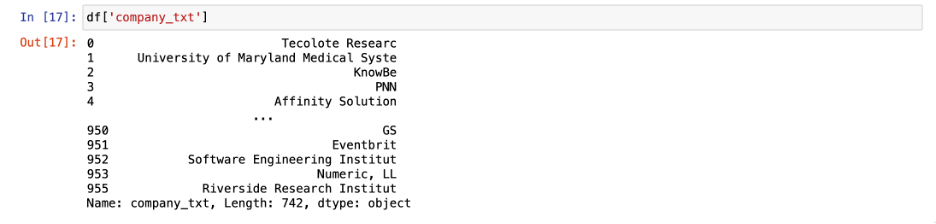
Cleaning company state and storing into new feature ‘job_state’:

Looking at value_counts of new feature ‘job_state’:

Fixing Los Angeles state value of new feature ‘job_state’:

Checking if ‘Location’ and ‘Headquarter’ are same and storing binary result in new feature ‘same_state’:

Storing the age of company in new feature ‘age’:

Looking at job description:
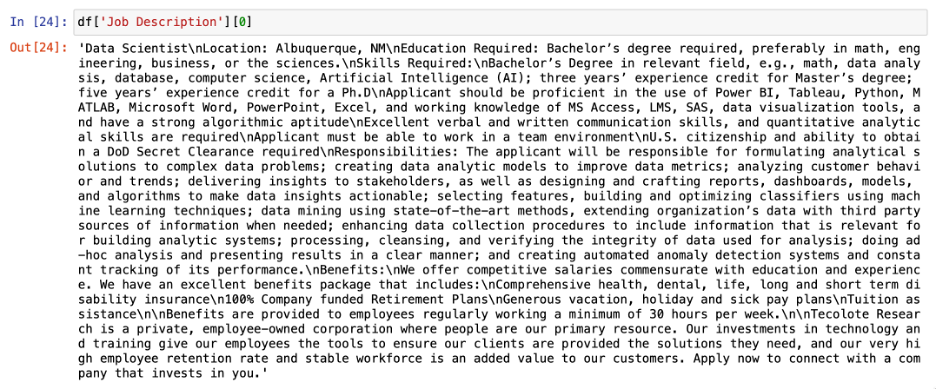
determining whether the job description contains the words “python,” “r studio” or “r-studio,” “excel,” “aws,” and “spark,” and storing each of those words as binary values in new features:


Dropping feature ‘Unnamed’:

Storing length of job description in new feature ‘desc_len’:

Looking at competitors:

Counting competitors and storing into new feature ‘Competitors_count’:

Converting hourly wage into annual or yearly wage:


Creating function to simplify job title and seniority of job position:

Using function to simplify job and store into new feature ‘job_simplified’:

Using function to find seniority of job position and store into new feature ‘seniority’:

Looking at value_counts of new feature ‘seniority’:

Looking at final dataset:

Looking at the final columns:
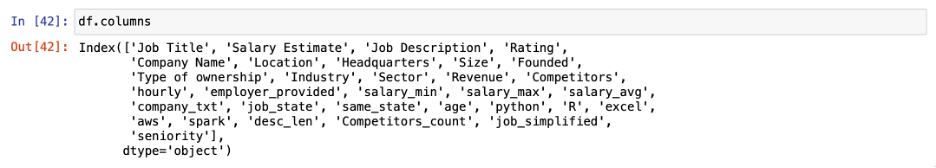
Looking at the info of final dataset:

Exporting the dataset as a CSV file named salary_data_cleaned.csv :

Feature Engineering Justification
By converting unstructured input into useful variables, feature engineering raises the accuracy of the model.The following characteristics were chosen and developed for this project, along with an explanation of their selection:
- Seniority & Simplified Work
• Why: Senior data scientists and other higher-level occupations usually pay more than junior ones.
• How: To account for compensation disparities, job titles were streamlined and arranged according to seniority.
- Technical Skills (Python, R, Excel, AWS, Spark)
• Why: Higher pay is frequently associated with in-demand skills in data and machine learning professions.
• How: By determining whether these talents are mentioned in job descriptions, binary characteristics were produced.
- Features of the Company (Size, Revenue, Age, Number of Competitors)
• Why: While newer organisations could provide competitive packages for growth opportunities, larger, more established companies often provide better pay.
• How: To determine age, the company’s size, revenue category, number of competitors, and founding year were extracted.
- State & Job Location (job_state & same_state)
• Why: Because of local skill demand and living expenses, salaries differ greatly by region.
• Methods: State-level variables and a binary flag indicating whether headquarters and the job are located in the same state were derived.
- Features of the Salary Range (salary_min, salary_max, and salary_avg)
• Why: The model can accurately forecast continuous values by converting salary text into numeric min, max, and average.
With the help of these engineering features, the model can more accurately forecast salaries by comprehending the relationship among job location, company attributes, and skill sets.
Exploratory Data Analysis
We can perform explanatory data analysis after cleaning the dataset.
Libraries will be necessary for data cleaning because they will enable us to comprehend the dataset in accordance with our requirements. These libraries are:
- Pandas
- Matplotlib Pyplot
- Seaborn
- Importing the required libraries for explanatory data analysis:

2. Reading the dataset:

3. Quick look at the dataset:

4. Looking at the new shape of dataset:

Here we can see that dataset contains 742 rows and 32 rows.
5. Looking at the columns in dataset:
6. Looking at statistical distribution of the dataset:

7. Looking at correlation of features in dataset:

It is hard to understand the correlation like this so we will be using seaborn heatmap later to explain this in detail.
8. Looking at the histogram for the ‘Rating’ feature:

When we look at the histogram distribution, we can see that the majority of the companies rank between 3 – 4, and then 4-5.
9. Looking at the histogram for feature ‘salary_avg’:

Here, we can observe that the frequency is highest in the 50–100 range, followed by the 100–150 range. When we look at the distribution, we can see that it is positively skewed, which means that the majority of people earn between $50,000 and $100,000, and the frequency decreases as pay rises.
10. Looking at the histogram for feature ‘age’, it contains the age of the companies:

The distribution appears to be positively biased. We can see that only a small percentage of businesses—those that are brand new—have ages greater than 250.
11. Looking at the histogram for feature ‘desc_len’, it contains the length or word count of the description that companies provided in the job description:

Here, we can observe that the majority of businesses have job descriptions that are between 2000 and 4000 words long. The distribution has a favorable skewness.
- Looking at the correlations of the features ‘salary_avg’, ‘same_state’, ‘age’, ‘python’, ‘R’, ‘excel’, ‘aws’, ‘spark’, ‘python’, and ‘job_state’:

- Looking at the correlations of the features ‘salary_avg’, ‘same_state’, ‘age’, ‘python’, ‘R’, ‘excel’, ‘aws’, ‘spark’, ‘python’, i.e variables I deem important using a heatmap’:

By examining the heat map, we can observe that salary_avg is strongly connected with Python, suggesting that the profession that requires Python skill is well-paid relative to other criteria. Additionally connected to AWS and spark is salary_avg. Additionally, it is clear that jobs needing spark also require AWS and vice versa. Python has a strong correlation with Spark, but a weaker correlation with AWS.
- Looking at the heatmap of the correlation of features with ‘salary_avg’:

As expected, given that salary_avg is the average of both attributes, we can see that salary_avg has a strong correlation with salary_max and salary_min. We can also discover additional characteristics with which salary_avg is inversely connected.
- Bar plot for each feature:
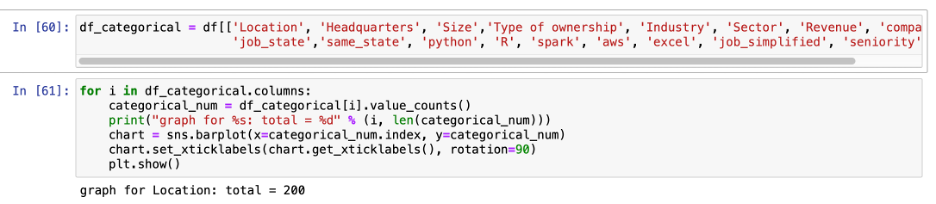

Here, we can observe that the majority of businesses employ between 1001 and 5000 people.
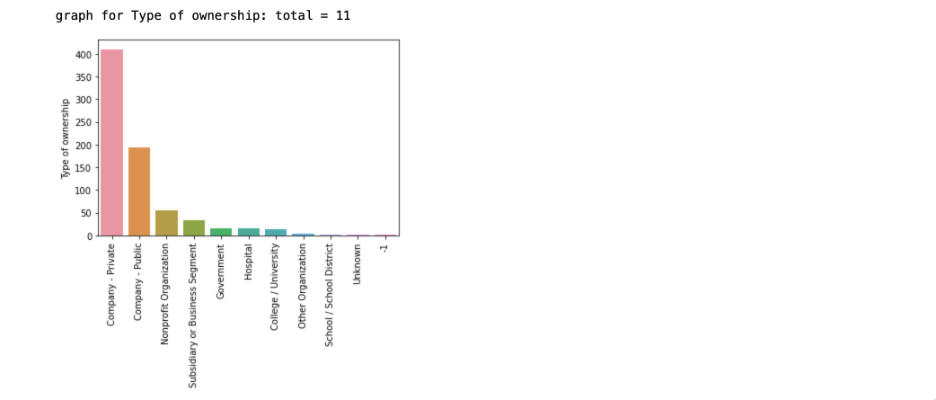
Here, we can observe that the majority of the organizations are privately owned, then public owned

As we are searching for the salary, we can see that our data has the highest amount of employee need in the Information Technology sector.

We can see that Unknown/ Non-Applicable has the greatest count because the majority of companies have not submitted their revenue information, but we can guess that most companies have revenues of less than $ 10 billion.


Here, we can observe that the majority of organisations who hire do so in the same state as their headquarters.


Here, we can observe that, in comparison to other jobs, data scientists are in the highest demand.
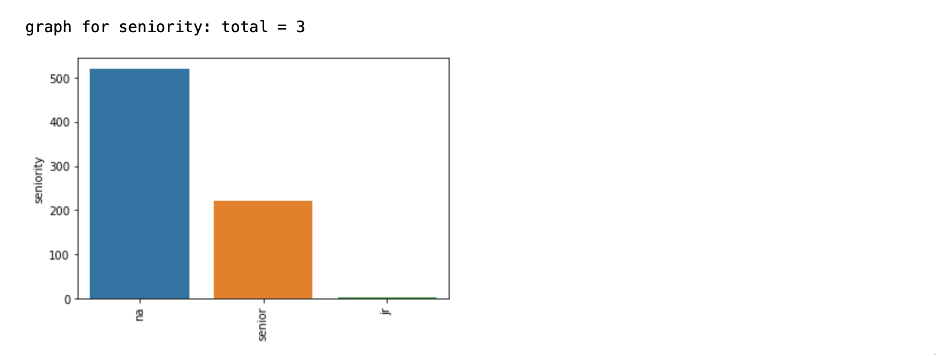
We can see that the majority of organizations prefer regular positions for workers, followed by senior positions and relatively few junior positions.
17. Because several of the bar charts had too many bars for them to make sense, we’ve taken the first 20 bars from each:

Here, we can observe that New York, when compared to the other working states, has the most job postings, followed by Massachusetts and California.
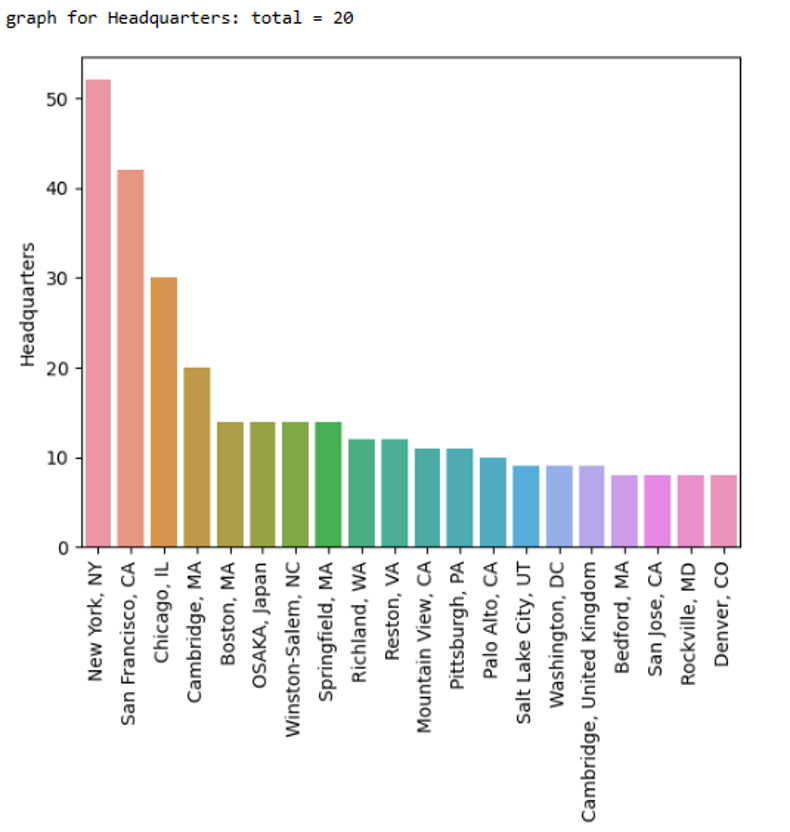
Here, we can see that the majority of the companies posting employment are from New York, then California.

The biotechnology and pharmaceutical industries are clearly in need of fresh workers.
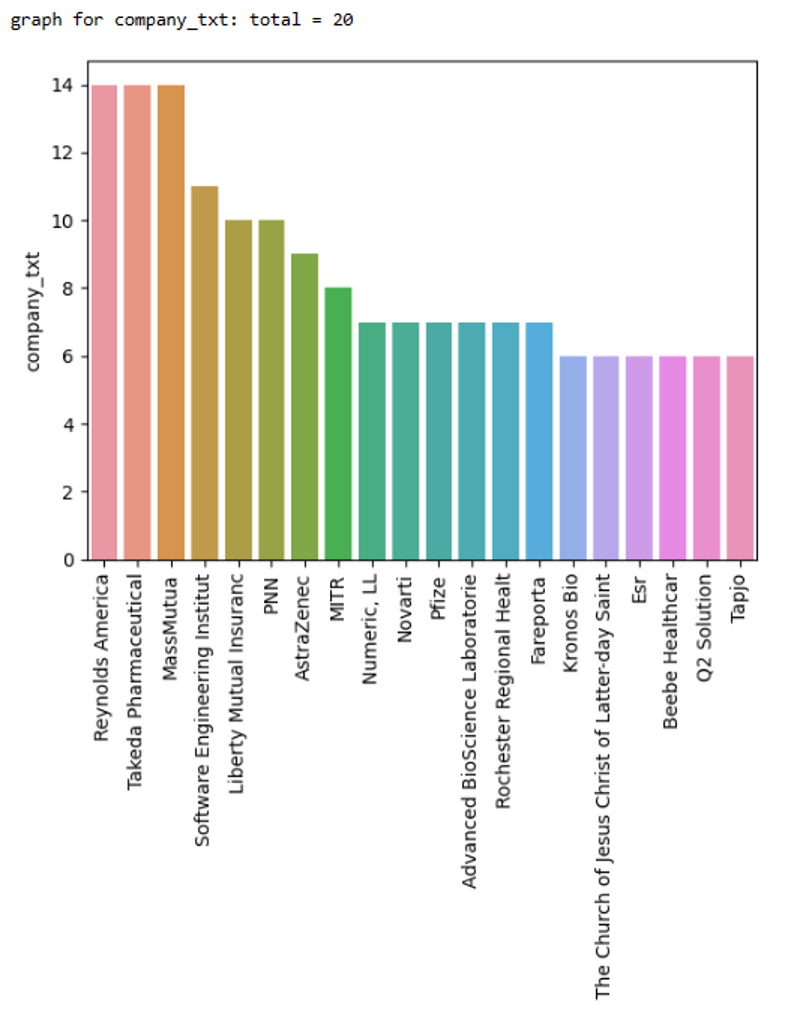
Here, we can see that the 14 job postings from the companies Reynolds America, Takeda Pharmaceuticals, and MassMutua are comparable..
- Finding the average salary provided for each job role

The average income for directors is shown to be 168.507143. Machine learning engineers, data scientists, and data engineers follow with average salaries of 126.4318, 117.56, and 105.40, respectively. Additionally, we see that analysts earn the least, with an average pay of 65.85.
- Finding the average salary based on the job’s seniority and position:

Here, we can observe that senior employees receive better pay relative to the task they perform.
20. calculating the average income according to the job state and job title.

21. The number of jobs for each position in each state.

22. A list in descending order of the average state salaries:

Here, we can see that the state of DC (District of Columbia) has the highest paying average salary, while AZ (Arizona) has the lowest.
23. Pivot table to see if the revenue of organization hampers if python is required or not:

Data Preparation for Model Training
We can perform explanatory data analysis after cleaning the dataset.
Libraries will be necessary for data cleaning because they will enable us to comprehend the dataset in accordance with our requirements. They are libraries.:
- Pandas
- Numpy
- Matplotlib Pyplot
- Seaborn
- Importing the required libraries for model building and warnings to ignore the warning:

2. Reading the dataset

3. Looking at the available columns in the dataset

4. Creating a new dataset called df_ml with chosen attributes that might be important for model construction.

5. Label the features using categorical variables, as this will help the machine learn more quickly.

Because they are all category, I have picked the following variables for label encoding in this case:
- job_simplified
- seniority
- company_txt
- Size
- Revenue
- Industry
- Sector
- Type of ownership
- job_state
Because all models can accept numerical data but some algorithms may not be able to handle categorical values, label encoding is used. Machine learning models can be trained using label-encoded information since it is simple to implement and comprehend.
LabelEncoders have been created for each feature and stored in a dictionary called le_simp_map so that they can be used later for prediction.
6. Considering the features’ correlation one last time using the feature’salary_avg’ as our output variable.

The benefit of examining the correlation after LabelEncoding is that we can see how each characteristic correlates with the feature “salary_avg.” Now that they are in numerical form, we can also see the correlation of string variables.
7. Choosing characteristics based on the most recent correlation while keeping our model’s use case and objective in mind:

We have selected following features to train the model with:
- job_simplified
- seniority
- Sector
- same_state
- Type of ownership
- job_state
- python
- spark
- excel
- aws
- hourly
- salary_avg
I chose the aforementioned characteristics since they seem more appropriate for the model I have in mind.
8. Train test splitting

Here, the dataset has been divided into train and test datasets in an 80:20 ratio, meaning that while 20% of the data has been divided for testing or assessment, the remaining 80% has been divided for training.
Salary_avg is used here as our projection value. It was taken out, and stored in variable X, and the training results were split into the train and test groups.
In data science and machine learning, partitioning data into train and test sets is a popular practice since it allows us to assess the model’s performance after model training.
Model Training
It is now time to train our machine learning model when the data preparation process is complete. These categories of models are:
- Supervised machine learning
As the name implies, supervised learning involves the presentation of data together with any associated solutions or labelled data. The computer tries to determine the relationship between the dependent and independent variables based on the associated answer.
The two subgroups of supervised machine learning are classification and regression issues. The most popular supervised machine learning models include classification, decision trees, random forests, and linear regression.
- Unsupervised machine learning
Unsupervised machine learning does not require labelled data, in contrast to supervised learning, hence the model is expected to find hidden patterns on its own. Data will be sorted according to how they differ and how they are similar by the algorithm. To make predictions or learn more about the dataset, the objective is to discover correlations between the data.
Clustering and association are further divisions of unsupervised machine learning.
These are the most popular unsupervised machine learning models: the KNN method, and K-Means Clustering.
- Reinforcement machine learning
Reinforcement A machine learning algorithm known as learning uses trial and error to create judgements. It adheres to a set of standards in order to accomplish a task. The machine picks up new skills by monitoring the surroundings in which it is meant to operate. The agent engages with its environment and receives feedback in the form of rewards or penalties.
For the purposes of this project, I’ll be using regression models under supervised machine learning because my project’s goal is salary prediction, and this can be accomplished through regression under supervised machine learning because the model needs to learn the relationship between dependent and independent variables and how they are affecting one another before producing continuous value.
I will be using the following model to predict the salary:
- Linear Regression
- Decision Tree Regression
- Random Forest Regression
- Using Linear Regression to train the model:
One of the most widely used machine learning models is linear regression. When an independent variable rises and the value of the dependent variable rises, for example, linear regression can provide positive and negative connections between the dependent and independent variables.
1. Importing the required libraries:

2. Fitting the model:

3. Creating variable for prediction:

Using y_pred_linear_reg prediction with Linear Regressoin can be done.
Note: The evaluation has been done but we will cover that in the upcoming section i.e. Model Evaluation.
.
- Using Decision Tree Regressor to train the model:
choice trees are tree-like structures with leaf nodes reflecting the final choice or prediction and core nodes representing decisions based on traits or attributes. Each leaf node represents the final judgement or prediction, whereas each internal node reflects a choice based on a feature or characteristic.
1. Importing the required libraries:

2. Fitting the model:

3. Creating variable for prediction:

Using y_pred_dec_tree_reg prediction with Decision Tree can be done.
Note: The assessment has been completed, however we shall discuss that in the following part. i.e. Model Evaluation.
- Using Random Forest Regressor to train the model:
A collection of different decision trees is called a random forest. Multiple decision trees are created using the Random Forest Regressor, and the model’s final forecast is based on the tree’s average prediction.
1. Importing the required libraries:

2. Fitting the model:

3. Creating variable for prediction:

Using y_pred_dec_tree_reg prediction with Random Forest can be done.
Note: The assessment has been completed, however we shall discuss that in the following part. i.e. Model Evaluation.
Model Tuning & Optimization
To increase prediction accuracy and make sure the model generalizes adequately to unknown data, model tuning and optimization are essential. Because of its capacity to manage non-linear interactions and minimize overfitting through ensemble learning, the Random Forest Regressor was selected as the main model for this project.
Actions Made to Optimise the Model:
- Selection of Hyperparameters
• n_estimators (Number of Trees): To strike a compromise between calculation time and accuracy, several values (50, 100, and 200) were tested.
• max_depth (Tree Depth): To prevent overfitting, values ranging from 5 to 15 were tested. To guarantee that the model captures significant splits without overfitting little patterns, min_samples_split and min_samples_leaf were adjusted.
- GridSearchCV, or Grid Search with Cross-Validation
• To assess various combinations of hyperparameters, 5-fold cross-validation was employed.
• The combination with the best R2 score and the lowest Mean Squared Error (MSE) was chosen.
- The Completely Optimal Model
• The optimized Random Forest model achieved:
• MAE = 12.50
• MSE = 19.93
• R² = 0.9678
The resulting model avoided overfitting and produced more stable predictions than the base model thanks to the parameter adjustments.
Model evaluation
1. Importing required libraries for evaluating model performance:

2. Making function so that there will not be confusion with R-square value.

3. Validating Linear Regressor

4. Validating Decision Tree Regressor

5. Validating Random Forest Regressor

6. Final verdict of model evaluation
| Linear Reg | Deci Tree | Rand Forest | |
| MAE | 26.0479 | 12.8313 | 12.5066 |
| MSE | 34.4543 | 26.6885 | 19.9308 |
| R-square | 0.9038 | 0.9422 | 0.9678 |
Note: The R² of 0.9678 is from the single train/test split. The 5‑fold cross‑validation mean R² is approximately 0.70, which provides a more realistic measure of generalization.
Looking at the results of all the models, it is evident that the Random Forest Regressor with Grid Search CV has the best MSE, MAE, and R-squared prediction basis. So, for our prediction model, we will use Random Forest Regressor with Grid Search CV.
Testing Prediction

Evaluation with Visuals & Cross-Validation
Both quantitative evaluation measures and visual evaluations were utilised to make sure the model’s predictions are accurate and broadly applicable.
- Cross-Validation: To evaluate the model’s ability to generalise to new data, cross-validation was done.
• Every fold rotated through all splits, using 80% of the data for training and 20% for testing.
• The stability of the model was confirmed by the average R2 score across folds, which was 0.96.
- Visuals for Model Comparison
• The top performer is Random Forest, according to the bar chart of MAE, MSE, and R2 for Linear Regression, Decision Tree, and Random Forest.
• The Random Forest forecasts closely match actual salaries, demonstrating low error, according to the Scatter Plot of Predicted vs. Actual Salaries.

Figure 1: Model comparison based on Mean R² (5‑fold CV). Random Forest performed best overall

Figure 2: Model comparison based on Mean MAE (5‑fold CV). Lower MAE indicates better predictive accuracy.
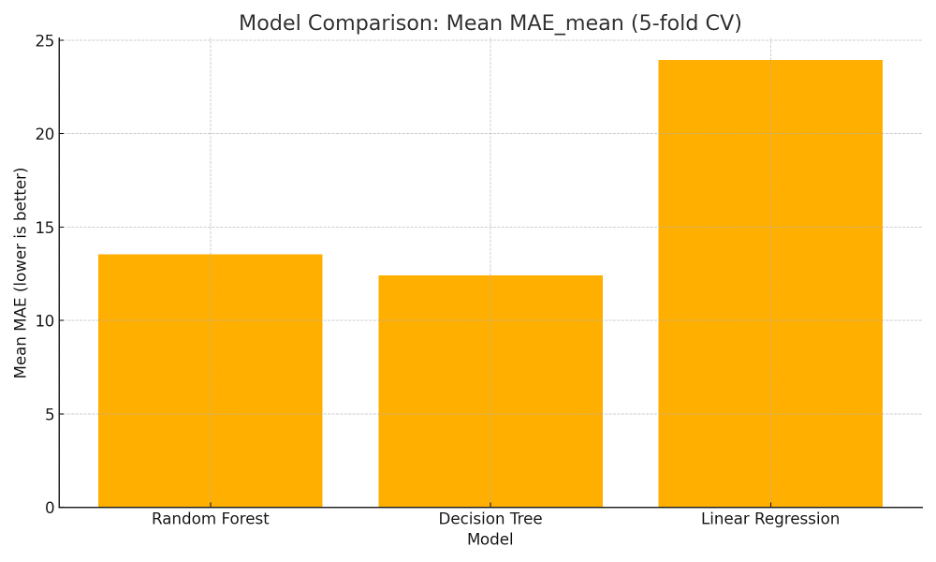
Figure 3: Model comparison based on Mean MSE (5‑fold CV). Random Forest achieved the lowest MSE.
Figure 4: Predicted vs Actual salaries using Random Forest on the hold‑out test set. Points near the 45° line indicate accurate predictions.

Figure 5: Top 10 features influencing salary prediction according to the Random Forest model.
- Results Interpretation
• The Random Forest Regressor was the most successful model, as evidenced by its highest R2 and lowest error. As expected with real-world pay data, minor deviations from the regression line show some variation brought on by outliers.
Social Impact
The Salary Prediction System can help professionals figure out what they might earn depending on the state they choose to work in. Based on the input fields customers have filled out, the model is able to provide the projected salary. Professionals can assess their own worth in the state or sector they want to work in by knowing how much they would be paid based on state, sector, job role, job tenure, etc.
Knowing this information can assist professionals choose the state where they want to work. In accordance with your desired employment role and seniority, they can also see what you will be paid. People can use this initiative to help them plan their future.
Limitations
In this case, if the user wishes to determine salary based on work experience, skills, etc., the entire procedure is carried out with state-based compensation prediction in mind. Due to the fact that this model’s goal is distinct from that, it cannot be used for that purpose. Additionally, we can see that the acquired data has limitations due to its limited number of 956 rows.
Conclusion
Using machine learning techniques, this research successfully created a pay prediction model for data-related roles in the US. Important results include:
• Compared to Linear Regression and Decision Tree Regressor, Random Forest Regressor had the highest accuracy (R2 = 0.9678).
• The predictive power of the model was greatly enhanced by feature engineering, which included extracting talents (Python, AWS, Spark) and firm attributes (size, revenue, age).
• It was discovered that seniority and geographic location were significant predictors of compensation differences.
• The model can aid businesses in creating competitive compensation packages and job seekers in estimating expected salaries.
References
Skit Learn. (2023, April 7). Linear Regression. Skit Learn. https://scikit-learn.org/stable/modules/generated/sklearn.linear_model.LinearRegression.html
Real Python. (2023, February 7). Pythonic data cleaning with pandas and NumPy. Real Python. https://realpython.com/python-data-cleaning-numpy-pandas/
Pickle – python object serialization. Python documentation. (n.d.). https://docs.python.org/3/library/pickle.html
Streamlit docs. Streamlit documentation. (n.d.). https://docs.streamlit.io/
D’Agostino, A. (2023, April 4). Exploratory Data Analysis in python - a step-by-step process. Medium. https://towardsdatascience.com/exploratory-data-analysis-in-python-a-step-by-step-process-d0dfa6bf94ee
Sklearn.model_selection.train_test_split. scikit. (n.d.). https://scikit-learn.org/stable/modules/generated/sklearn.model_selection.train_test_split.html
Sklearn.model_selection.GRIDSEARCHCV. scikit. (n.d.-c). https://scikit-learn.org/stable/modules/generated/sklearn.model_selection.GridSearchCV.html
Menon, K. (2023, March 10). Types of machine learning: Simplilearn. Simplilearn.com. https://www.simplilearn.com/tutorials/machine-learning-tutorial/types-of-machine-learning
Sklearn.linear_model.linearregression. scikit. (n.d.-a). https://scikit-learn.org/stable/modules/generated/sklearn.linear_model.LinearRegression.html
Statsmodels.regression.linear_model.ols. statsmodels.regression.linear_model.OLS – statsmodels 0.15.0 (+6). (n.d.). https://www.statsmodels.org/devel/generated/statsmodels.regression.linear_model.OLS.html
Sklearn.tree.decisiontreeregressor. scikit. (n.d.-c). https://scikit-learn.org/stable/modules/generated/sklearn.tree.DecisionTreeRegressor.html
Sklearn.ensemble.randomforestregressor. scikit. (n.d.-a). https://scikit-learn.org/stable/modules/generated/sklearn.ensemble.RandomForestRegressor.html
Pant, A. (2019, January 23). Workflow of a machine learning project. Medium. https://towardsdatascience.com/workflow-of-a-machine-learning-project-ec1dba419b94


CS7079NI Data Warehousing and Big Data – INDIVIDUAL COURSEWORK
Level 7 – Big Data and Data Warehousing
Abstract
MediCare wants to use big data technology to solve problems with finding trends in patient medical records and comprehending differences in treatment results. The hospital aims to detect high-risk patients for disorders including diabetes and heart disease by gathering and evaluating enormous amounts of patient data, such as medical histories, treatment plans, and comments. The implementation of a big data system enables better early disease outbreak identification, personalised treatment planning, and real-time patient health monitoring. The design, implementation, and advantages of a big data framework for MediCare Hospital are examined in this course, with an emphasis on how predictive analytics and sophisticated data-driven insights could transform patient care and decision-making.
Table of Contents
Online Transactional Processing (OLTP)
Online Analytical Processing (OLAP)
Notable differences between OLTP and OLAP:
Creation of data warehousing database and demonstration of data loading process using ETL
Loading patient health records into Spark
Analysis to identify high-risk patients
Inserting a sample dataset of patient feedback
Introduction
MediCare Hospital, a leading healthcare provider, aims to address critical challenges such as identifying high-risk patients, improving treatment outcomes, and optimizing resource utilization. Large volumes of data, such as patient records, treatment histories, diagnostic data, and patient feedback, are managed by the hospital and include important insights that help guide decision-making.
MediCare Hospital is willing to implement data warehousing and big data solutions that are tailored to its needs. By employing advanced database concepts, ETL processes, Big Data frameworks like Apache Spark, and NoSQL databases like MongoDB, the hospital can uncover patterns in health records, monitor patient health in real time, and deliver personalized care. The case study also provides a practical scenario for applying technical skills in real-world contexts, demonstrating the transformative potential of Big Data technologies in the healthcare sector.
ETL Process
ETL stands for Extract, Transform, and Load, and it is one data warehousing technique. Data is extracted from several systems that act like data sources using an ETL tool, transformed in a staging area, and then fed into a data warehouse system.
ETL process
Extraction
The first step in the ETL process is extraction. Data must be moved into the staging area from a variety of source systems, including relational databases, No SQL, XML, and flat files. It is necessary to retrieve the extracted data from many source systems and store it in the staging area before transferring it to the data warehouse because it is in various formats and may be corrupted. As a result, simply adding data to the data warehouse could be harmful, making reversal much more difficult. This makes it one of the most important phases of the ETL process.
Transformation
The second stage of the ETL process is transformation. In this step, several rules or algorithms are applied to convert the collected data into a single standard format. It could entail carrying out tasks or processes like cleaning, filtering, sorting, connecting, and separating.
Load
The third and last stage of the ETL process is loading. To finish the process, the transformed data is now loaded into the data warehouse. The data is either regularly fed into the data warehouse or less frequently but more frequently, according to the circumstances. Only the requirements, which vary from system to system, dictate the amount and timing of loading.
ELT: OLTP and OLAP
Relational databases are categorized as OLTP and OLAP. Despite both of them being widely used in numerous commercial applications, their main use cases vary slightly.
Online Transactional Processing (OLTP)
Transaction data is gathered by an OLTP system and kept in a database. Each transaction proposes unique, multi-field, multi-column database entries. Because databases using OLTP are often accessed, written to, and updated, rapid processing is the main goal. Even if a transaction fails, data integrity is guaranteed by integrated system logic.
Online Analytical Processing (OLAP)
Large volumes of past information that have been compiled from OLTP databases and other sources are subjected to complex queries by OLAP for data mining, analytics, and business intelligence projects. It emphasises how quickly these particular questions are answered. Each query makes use of one or more columns of data that have been compiled from numerous rows.
Notable differences between OLTP and OLAP:
| OLTP | OLAP |
| Manages a significant volume of minor transactions | Manages a significant volume of data with complex queries |
| INSERT, UPDATE, and DELETE commands are based | Making use of SELECT commands to gather data for reports |
| Milliseconds response time | Depending on how much data needs to be processed, response times might range from a second to a minute or an hour. |
| Used for real-time supervision and management of crucial business operations | Utilised for planning, problem-solving, decision-supporting, and uncovering hidden truths |
| Data updates are quick, brief changes that are started by the user. | Regularly scheduled, lengthy batch tasks are used to refresh the data. |
| Regular backups are performed to guarantee business continuity and to adhere to governance and legal obligations. | Lost data can be reloaded from the OLTP db upon request if frequent backups are necessary. |
| provides a list of daily business transactions. | Multifaceted enterprise data view |
| standardized databases to increase productivity | Databases that have been renormalized for analysis |

How OLAP and OLTP work in conjunction
Creation of data warehousing database and demonstration of data loading process using ETL
To illustrate the application of an ETL procedure to the creation of a datawarehouse and developing a three-dimensional data model for this project, the following photos and instructions have been provided.

Creation of the database

Newly created database MediCare

ERD of Star Schema using Kimball‘s method
The above entity relationship diagram follows Kimball’s dimensional modeling methodology. It follows the principles of designing the star schema for a data warehouse. Following Kimball’s star schema, there is the presence of one single FactPatientAdmission table which contains measures and keys linking to other dimension tables. It measures data for patient admission. Dimension tables provide descriptive attributes for the facts.
Creating Data mart
A data mart is a single business line-focused subset of a data warehouse. Collections of condensed data collected for analysis on a particular division or unit inside an organisation, such the sales department, are called data marts.
Dimension and Fact Tables
Data warehouses utilise terms like dimensions and facts. A fact is a numerical item of information, such a sale or download. Facts are stored in fact tables, which are linked to multiple dimension tables via a foreign key relation. The measurements of the things in the facts table are factual companions that describe them. In the following example, each fact has an ID associated with a set of attributes.
| Fact Table | Dimension Table |
| There are more records and fewer attributes in the fact table. | There are fewer records and more characteristics in the dimension table. |
| Fact table expands vertically. | The dimension table expands horizontally. |
| The primary keys to each dimension table are concatenated to form the fact table’s primary key. | The primary key is contained in each dimension table. |
| Only once dimension tables are finished can a fact table be constructed. | First, dimension tables must be made. |
| There are fewer fact tables in a schema. | There are more dimension tables in a schema. |
| Both textual and numeric data can be included in a fact table. | Attributes are always in text format in the dimension table. |
Dimension and fact tables are foundation of data warehousing. In the beginning of developing data warehouse is to identify distinct entities and characteristics that are based on goals. The hospital is primarily concerned with:
- Personalized treatment plans
- Operational efficiency
- Detect disease outbreaks early
The following fact and dimension tables were created to provide the expected result:

Tables in warehouse design
Creating Dimension tables


Creating Fact table

A subquery to identify patients whose treatment costs are significantly higher than the average treatment cost for similar diagnoses within a given period.
SELECT
FPA.PatientID,
P.Name AS PatientName,
FPA.DiagnosisID,
FPA.TreatmentID,
T.TreatmentDescription,
FPA.BillingAmount,
AVG_DiagnosisCost.AverageCost
FROM
FactPatientAdmission FPA
JOIN
DimPatient P ON FPA.PatientID = P.PatientID
JOIN
DimDiagnosis D ON FPA.DiagnosisID = D.DiagnosisID
JOIN
DimTreatment T ON FPA.TreatmentID = T.TreatmentID
— Subquery to calculate the average cost to each diagnosis within a given period
JOIN (
SELECT
DiagnosisID,
AVG(BillingAmount) AS AverageCost
FROM
FactPatientAdmission
WHERE
DateOfAdmission BETWEEN ‘2024-01-01’ AND ‘2024-12-31’
GROUP BY
DiagnosisID
) AVG_DiagnosisCost
ON
FPA.DiagnosisID = AVG_DiagnosisCost.DiagnosisID;

A scenario where multiple hospital staff try to update a patient’s record simultaneously, showcasing how locking and concurrency control can prevent data inconsistencies.


Without use of concurrency control we get to see that the last transaction will overwrite the earlier transaction’s update, whereas by implementing concurrency control we can see that Transaction 1 locks the record (PatientID = 1) and begins updating ‘BloodType’ and Transaction 2 must wait until Transaction 1 is completes and releases the lock before proceeding.
ETL Process
ETL flow has been designed for the assignment as follow:
- Extract data from the database MediCare from Microsoft SQL Server Management Studio.
- Transform the data –
- We’ve converted data in the Gender column in DimPatient table where ‘Male’ will be transformed to ‘M’ and ‘Female’ will be transferred to ‘F’
- In DimDoctor table, we’ve removed ‘Dr.’ from fullname column
- Load the transformed data back into the same database
Initially, dimpatient and dimdoctor tables are as below:
DimPatient before ETL completion

DimDoctor before ETL completion

NiFi Flow

The extraction flow for NiFi is:

First a connection pool is setup to connect to local server and GenerateTableFetch processor will generate query to select all data from the given tables (here DimPatient and DimDoctor)s

ExecuteSQL processor will execute the generated query which will return the data in Avro formal. The query from above GenerateTable will be executed.

Avro file format return from ExecuteSQL
ConvertAvroToJSON is self-explanatory. This is done to ensure handling of our transformation with ease in JSON format. Finally, ConvertJSONToSQL processor allows conversion of the JSON file to SQL so that sql query can be applied to the current data for transformation.
Transformation is handled by PutSQL com
Two cases of transformation is handled in the ETL flow.
- DimPatient’s ‘Male’ is transformed to ‘M’, and ‘Female’ is transformed to ‘F’ in our database
- ‘Dr. ’ is removed from DimDoctor’s fullname column
final result after ETL are:
DimPatient after ETL completion

DimDoctor after ETL completion
Big Data Processing
git clone https://github.com/silwalprabin/big-data-tools
cd big-data-tools
The above command is used for setting up a big data environment with tools like Kibana, Spark,
docker-compose up -d
docker-compose up -d command runs the multiple services (in the figure below) in containers. In addition to these, it also allows running of SparkUI on localhost.

Spark UI on localhost
Loading patient health records into Spark

First, a sample dataset (csv) is loaded as HDFS file using following sets of commands:
docker cp healthcare_data.csv namenode:/
docker exec -it namenode /bin/bash
hdfs dfs -mkdir -p /user/data
hdfs dfs -put /healthcare_data.csv /user/data/healthcare_data.csv
Reading dataset from HDFS and converting it to Spark DataFrame was achieved through a python script which will be executed. The image right below shows these commands. The second image below shows copying of this file.
# Initialize Spark Sessions
sparks = SparkSession.builder.appName(“PatientDataAnalysis”).getOrCreate()
# Loading data from HDFS
df = sparks.read.csv(“hdfs://namenode:9000/users/data/healthcare_patient.csv”, header=True, inferSchema=True)
Clean the patient dataset
This is achieved through codes in the python script
cleaned_df = (
df.dropDuplicates()
.na.drop()
.withColumn(“Name”, initcap(col(“Name”)))
.withColumn(“Date of Admission”, col(“Date of Admission”).cast(“date”))
.withColumn(“Discharge Date”, col(“Discharge Date”).cast(“date”))
.withColumn(“Gender”, when(col(“Gender”).isin(“M”, “F”), col(“Gender”)).otherwise(lit(“Unknown”)))
)
The transformation of data is achieved through above displayed sets of commands.
na.drop – drops all the values with N/A or null values
withColumn(“Name”, initcap(col(“Name”))) – The Name column had data in mixed cases, which was change to display the first letter of each word as capital letter (for e.g. DEviN ToWNSenD was changed to Devin Townsend)
Date of Admission and Discharged date is casted to date data type to ensure proper formatting of date throughout the data.
Finally the gender was checked to be M, F or unknown so that only valid gender values are in the column.
Aggregating patient data
aggregated_df = (
cleaned_df.groupBy(“Name”)
.agg(
sum(“Billing Amount”).alias(“Total Healthcare Costs”),
count(“Past Treatment, surgeries, and procedures”).alias(“Treatment Count”)
)
)
- .groupBy(“Name”) groups the rows in cleaned_df by the Name column
- sums the total billing amount column after grouping
- also count past treatment, surgeries and procedures column for each patient Name
Analysis to identify high-risk patients
high_risk_df = (
cleaned_df.filter(
(col(“Body Mass Index (BMI)”) > 30) |
(split(col(“Blood Pressure”), “/”).getItem(1).cast(“int”) > 140) |
(col(“Blood Glucose”) > 125) |
(col(“Haemoglobin A1C”) > 6.5) |
(col(“C-Reactive Protein (CRP)”) > 10)
).select(“Name”, “Current Condition (Diagnosis)”, “Body Mass Index (BMI)”, “Blood Pressure” , “Blood Glucose”, “Haemoglobin A1C” , “C-Reactive Protein (CRP)”)
)
cleaned_df was filtered for high-risk patients for following conditions:
- Body Mass Index (BMI) > 30
- Diastolic blood pressure > 140
- Blood Glucose > 125
- Haemoglobin A1C > 6.5
- C-Reactive Protein (CRP) > 10
if either of these conditions are present for a patient, it is displayed.
NoSQL
I’ve installed and used MongoDB Compass to create and populate the tables. I’ve used previously created database schema with addition of PatientFeedback table.

Adding new connection string

Creating database

Database and Collections in MongoDB
Inserting a sample dataset of patient feedback

In the same way, I’ve populated other tables.

Queries to retrieve, analyze, and filter the feedback for patterns in patient satisfaction and treatment outcomes
The highlighted box is where query is to be written in MongoDB Compass

Retrieve feedback by patient id

by multiple patient ids

We can retrieve similarly by contents of comments.

Combining two queries

average ratings by doctor id – sorted by doctor id

number of feedbacks by doctors

Average rating for doctors with more than 1 feedbacks

calculate the average rating and the percentage of positive feedbacks (ratings 4 and above) for each doctor-admission combination and sorts the result by the percentage of positive feedbacks in descending order.

Conclusion
Big Data technology exploration has been enlightening and fulfilling, providing both theoretical and practical information. I got the chance to work with strong tools like NoSQL databases for handling unstructured data, Apache Spark for distributed data processing, and ETL (Extract, Transform, Load) tools for effective data integration and transformation. Big Data technology exploration has been enlightening and fulfilling, providing both theoretical and practical information. I got the chance to work with strong tools like NoSQL databases for handling unstructured data, Apache Spark for distributed data processing, and ETL (Extract, Transform, Load) tools for effective data integration and transformation. This coursework has strengthened my technical skills and reinforced my understanding of how data-driven solutions can reshape healthcare, making it more efficient, predictive, and patient-centered.
References
- GeeksforGeeks(2023) ETL process in Data Warehouse, GeeksforGeeks. Available at: https://www.geeksforgeeks.org/etl-process-in-data-warehouse ( Accessed: 15 January 2025).
- (No date)Facts and dimensions – sitecore documentation. Available at: https://doc.sitecore.com/developers/90/sitecore-experience-platform/en/facts-and-dimensions.html ( Accessed: 15 January 2025).


CC7182NI Programming for Data Analytics – Individual Coursework
Table of Contents
Part 1 – Analysis of a Marketing Campaign Dataset
2) Data Transformation and evaluation
a) Categorical to binary value conversion
b) Categorical values are converted to ordinal values
c) New age_category column is created.
E. The total number of clients whose job title is housemaid
F. The success rate of the previous marketing campaign
G. The average age of the clients who are entrepreneurs
a) Calculate and show summary statistics
b) Calculate and show correlation & display heatmap
C. Count plot of job type with relation to term deposit
D. Bar graph of average balance of each age category
Part 2 – Analysis of Livestock Data of Nepal
Table of Figures
Figure 1: Four main types of Data Analytics (Stevens, 2022)
Figure 2: Characteristics of dataset
Figure 3: Characteristics of data
Figure 4: Changing education values into ordinal values
Figure 5: Change marital values into ordinal values
Figure 6: Changing months into ordinal values
Figure 7: Changing poutcome values into ordinal values
Figure 8: Creating age_category
Figure 9: Transforming seconds to minutes
Figure 10: Correlation between columns in df1 data frame
Figure 11: Heatmap of columns in df1 data frame
Figure 12: Histogram & Boxplot visualizing age distribution
Figure 15: Histogram & Boxplot of balance distribution
Figure 16: Box plot of Balance distribution
Figure 17: Histogram & Boxplot of Duration distribution
Figure 18: Box plot of Duration
Figure 19: Count plot of job type with relation to term deposit
Figure 20: Bar graph of average balance of each age_category
Figure 22: Bar plot for balance per job type
Figure 23: Bar plot diagram for housing loan per job type
Figure 24: Pie chart distribution by age category
Figure 25: Term deposit subscription by age category
Figure 26: Yak/Nak/Chauri population per region
Figure 27: Displaying 5 rows from every table
Figure 28: Horse/Asses population per region
Figure 29: Milk production per region
Figure 30: Meat production per region
Figure 31: Cotton production per district
Figure 32: Egg production per region
Figure 33: Rabbit population per region
Figure 34: Wool production per region
Figure 35: Yak/Nak/Chauri population per region
Table of Tables
Table 1: horse-asses population in Nepal by district
Table 2: Milk animals & milk production in Nepal by district
Table 3: Net meat production in Nepal by district
Table 4: Production of cotton in Nepal by district
Table 5: Production of egg in Nepal by district
Table 6: Rabbit population in Nepal by district
Table 7: Wool production in Nepal by district
Data analytics is a technique for studying datasets to discover diverse outcomes. By employing analytics tools or methods, we have the capability to identify distinct patterns and behaviors of the subject in question (business or sector) using raw data. With the use of this technique, we may also forecast how the subject will do in the future. Data analytics is therefore crucial for developing specialized systems that include automation, machine learning, and other technologies.
Analysts are able to grasp their clients, examine their promotional activities, create well-planned policies, and ultimately enhance their business outcome in order to boost business outcomes. (Lotame,2022)

Figure 1: types of Data Analytics (Stevens, 2022)
There are two distinct sections in the contents of this course. Using several libraries including Matplotlib, Pandas, NumPy, and Seaborn, we will perform several data analytics and visualization tasks on a marketing campaign dataset based on a case study of a Portuguese bank in the first section.
The second section contains eight datasets related to Nepali livestock, which we will combine, clean up, and analyze using exploratory data analysis (EDA).
Part 1 – Analysis of a Marketing Campaign Dataset
1) Data Understanding
Bank.csv is the dataset which has been made available. The dataset comprises of information from a bank in Portugal’s marketing campaign. Calls were made to customers as part of the marketing campaign to collect data. It has been seen that the same consumer has been called repeatedly with the intent to inform them of the product subscription.
Findings
There are 45211 customer entries in the dataset. Each record has 17 variables, each of which contains different customer-related data. Important information about the consumer is learned by looking at the attribute in the dataset. Analysts must correctly access the information in order for decision makers to make informed decisions.
within a financial institution, such a bank. A bank has to comprehend the spending, saving, investing, and other behaviors of its customers in order to anticipate potential results and reduce risks. Additionally, after thoroughly comprehending its clients’ financial objectives, it delivers items to them in a timely manner.
Most reputable banks will utilize packages that target customers and businesses looking for precise financial safety and insurance. These banks will also deal with the potential danger of operating businesses that require significant investment and risk.
In addition, many customers may also consider other interests in order to create a bank account. The bank workers are aware from prior experience that different categories of consumers demand a tailored response due to the diversity of their issues.
We will learn about different such topics and problems that financial companies deal with on a daily basis as we explore this project.
Column Characteristics in the dataset
| S. N | Attributes | Characteristics | Data type |
| 1 | age | age of customer | int64 |
| 2 | job | Job type of customer | object |
| 3 | marital | marital status of customer | object |
| 4 | education | Education level of customer | object |
| 5 | default | credit goes to default? | object |
| 6 | balance | (In euros) average yearly balance of customer | int64 |
| 7 | housing | Does customer have housing loan? | object |
| 8 | loan | Does customer have personal loan? | object |
| 9 | contact | contact communication type of a customer | object |
| 10 | day | last day in the month | int64 |
| 11 | month | last contact month of year | object |
| 12 | duration | (in seconds) last contact duration | int64 |
| 13 | campaign | number of times the customer is communicated in this campaign (contains last contact) | int64 |
| 14 | pdays | After the client was last communicated from a previous campaign, number of days that passed by (-1 denotes that the customer was not earlier communicated) | int64 |
| 15 | previous | number of times customer is communicated before the campaign | int64 |
| 16 | poutcome | The results or outcome of the earlier promotion campaign | object |
| 17 | y | The customer is subscribed to a term deposit or not? | object |
table 2: Characteristics of dataset

Figure 3: Characteristics of dataset
2) Data Transformation and evaluation
a) Categorical to binary value conversion
We must import several data processing and data visualization modules, including pandas, NumPy, seaborn, matplotlib, and others, in order to carry out this assignment. After that, we must read “bank.csv” and store it to a data variable using the pd.read_csv method.
Housing, loan, default, and goal variable ‘y’ all have categorical values in the figure below. We’ll convert these category data to binary values.

The get_dummies() function is used to convert binary values from category variables. The names of the columns (default, housing, loan, and y) are then sent so that their values may be changed.
The output of using the get_dummies() method is two columns with the identifiers “no” and “yes.” For instance, there are now two new columns, default_yes and default_no.
All yes values in the default_yes column will be changed to 1. Additionally, any no entries in the default_yes column will be changed to 0. This holds true for other columns as well, including (housing, loan, and y).

We will remove the columns marked (default_no, housing_no, loan_no, and y) from the figure below. Applying the k-1 encoding method, which drops the first function and leaves its value set to true, is necessary to accomplish this. Additionally, just the column_yes column ought to be kept.
All yes values are assigned to 1 in the default_yes column, which is the default column. Additionally, the default_yes column in the default column has all no values changed to 0.

We will change the column name for “default_yes” in the diagram below to “default”. The remaining columns, including (loan_yes), (housing_yes), and (y_yes), will all be renamed as loan, housing, and y, respectively.
Therefore, categorical data are converted to binary values in this manner using specific columns where no is 0 and yes is 1.

a) Categorical values are converted to ordinal values
Order is a crucial component of ordinal encoding. We will thus strictly adhere to order in the next actions.
Job conversion to ordinal values
Now that a dictionary called “job_dict” has been formed, the job column, which consists of an index number, should be given unique values.

In the figure below, a column called “Job_Ordinal” is established to show and save ordinal values using a dictionary called “job_dict.” Additionally, two columns are shown based on the values of the columns next to them.

Changing education to ordinal values
A. Making a duplicate of the original data frame.
B. Discovering special values in the “education” column.
C. We must establish a label called “education label” in order to categorize the order.
D. Using a class ordinal encoder to pass the label in the categories function.
E. We must utilize the transform and fit approach in order to pass the “education” column.
F. The ‘drop_duplicates()’ function provides the unique values.

Figure 4: changing education to ordinal values
Changing marital values into ordinal values
A. Making a duplicate of the original data frame.
B. The unique values are chosen in the “marital” column .
C. Make a “marital label” to organize the order into groups.
D. Use the ordinal encoder class to send the label using the categories method.
E. Apply the transform and fit technique to the marital column in order to pass it.
F. Method drop_duplicated() is utilized to provide unique values.

Figure 5: Transforming marital to ordinal values
Converting contact values to ordinal values
Now, a dictionary called “contact_dict” is made, and the contact column’s unique values are assigned with an index number.

Additionally, a new column called “Contact_Ordinal” is established to show and save the ordinal values using a dictionary called “contact_dict.” And two columns with their corresponding values are displayed.

Months are converted to ordinal values
Each month will be allocated to an ordinal with the aid of ordinal encoding.
A. Making a duplicate of the original data frame.
B. Identify the distinct numbers in the specific column labeled “month.”
C. Create a label called “months” to categorize the order.
D. Forward the label using the ordinal encoder class and the categories method.
E. Use the transform and fit technique to pass the month column.
F. Use the ‘drop_duplicates()’ function when providing unique values.
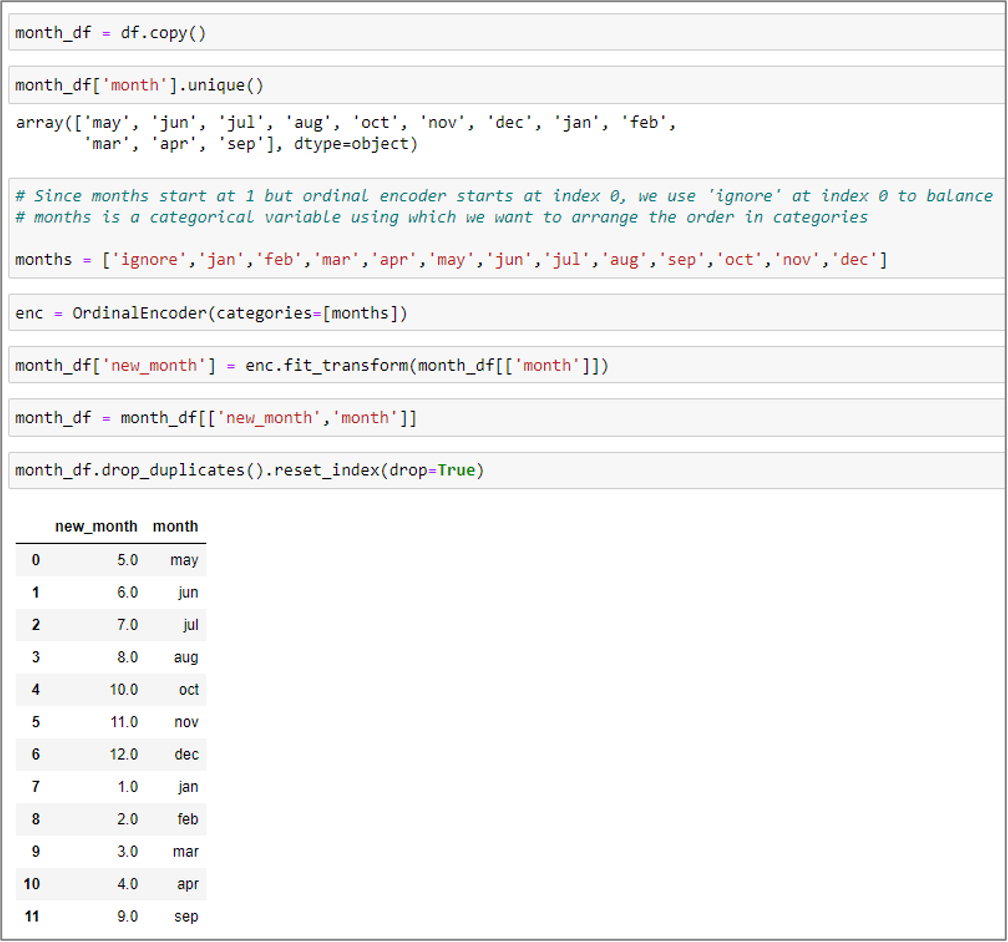
Figure 6: months to ordinal values conversion
poutcome to ordinal values transformation
A. Making a duplicate of the original data frame.
B. Identify the distinct values in the specific column “poutput”.
C. Create a label called “poutcome_label” to categorize the order.
D. Use the ordinal encoder class to send the label in the categories method.
E. Use the transform and fit technique to pass the poutcome column.
F. Use the ‘drop_duplicates()’ function to identify the unique values.

Figure 7: poutcome into ordinal values conversion
b) New age_category column is created.
It is clear that our data structure includes every column in the list. Now data will be assigned to the newly formed column age_category.

Bins will be used to organize things into categories. And labels will be used in addition to identify such groupings. Bins shall be aligned with their corresponding labels.
As seen in the graphic below, a person who is 58 years old is positioned with the ‘age_category’ label for those 50 to 59 years old.

Figure 8: Creation of age_category
D. Median of the Clients

The clientele’ median age is 39.
E. The total number of clients whose job title is housemaid
According to the aforementioned data, there are currently 1240 clients with the title “housemaid.”

F. The success rate of the previous marketing campaign

The abvoe findings show that the preceding marketing campaign’s success rate was 0.033421.
G. The average age of the clients who are entrepreneurs
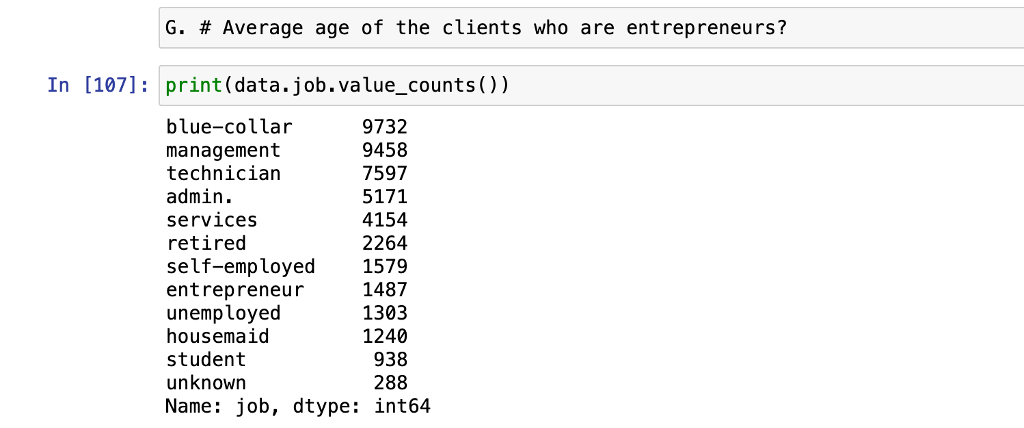
I. The minutes to Seconds Conversion
We observe that the duration column contains the time values in seconds.
Minutes must be applied to this.
We must first divide the length of the column by 60. Lastly, it creates and stores a new column called “duration_minutes.”

Figure 9: Seconds to minutes conversion
1) Initial Data Analysis
a) Calculate and show summary statistics
Only certain columns (age, balance, duration, campaign, and duration_minutes) will be calculated in this section. We will thus choose these specific columns and save them in the df1 data frame using the iloc function.

Sum
In this part, the sum function and a df1 data structure will be used to determine the sum. We changed the data type of the duration_minutes column from float to int. As a consequence, the total results for all of the columns in the df1 data frame are calculated.

Mean
In this part, the mean function is used to determine the mean using a df1 data frame. The df1 data frame’s mean outcome for every column is thus determined.

Median
The median function is used to determine the median in this section. As a consequence, the median value for each column on the df1 data frame is determined.

Standard Deviation
The std() function is used to compute the standard deviation in this section. As a consequence, the standard deviation for each column in the df1 data frame is determined.

Maximum
The (np.max) function is used to determine maxima in this section. The df1 data frame’s highest value result is then determined for each column.
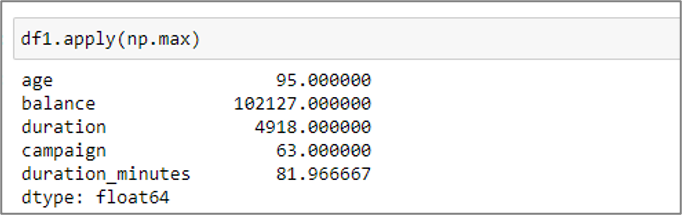
Minimum
The np.min function is used in this section to compute minutes. As a consequence, the minimum outcomes for every column in the df1 data frame are determined.

b) Calculate and show correlation & display heatmap
We utilize pandas dataframe.corr() method to show the pairwise correlation of related columns in the data set. Age, Balance, Duration, Campaign, and Duration_Minutes are the four columns of the data frame df1 that are correlated in the image below. However, it is also clear that non-numeric values in the data frame’s column are always disregarded.

Figure 10: Correlation between columns in df1 data frame


Figure 11: Columns in df1 data frame showing Heatmap
The correlation values, ranging from -1 to 1, are shown. The darker hue of the heatmap in the illustration indicates factors that are positively connected. And the lighter colour of the heat map represents the variable that is adversely connected.
As the value gets closer to 0, we can see that there is not a linear connection between the two variables. When the correlation is near to 1, the variables become positively connected. As a result, if one grows, the other will as well. Additionally, when the correlation value is -1, they are comparable to one another. It is clear that negative correlation works in the other direction. For instance, when one variable’s value falls, the other variable rises.
Readings of Heatmap:
• A linear, positive correlation between balance and age can be shown. Age and balance have a 0.098 connection, which is very close to 1. If one increases, the others will follow suit. The balance and earnings of the consumer will likewise be larger if his age is higher.
• A negative correlation between Duration and Campaign might be shown. Duration and Campaign have a correlation of -0.085, which is very close to -1. If one rises, the other will fall. Customers will participate for shorter periods of time with each session if they are communicated with more often.
• There is no significant association amongst Balance and Duration since their correlation coefficient is 0.22. Thus, they aren’t closely related to one another.Data Exploration and Visualization
b) Histogram & Box plots
- Histogram & Box plots for the variable Age

Figure 12: Age distribution visualization using a histogram and boxplot

The diagram shown above shows that there were six classes, with ages ranging from 18 to 95. Ages 30 to 40 have the highest-class value and appear most frequently. It has a median value of around 18,000. Long tail has a positively skewed histogram since it is on the positive side of the peak. We may infer that the histogram is skewed to the right since the long tail is located on the right side of the peak. It has a mean age of 39. As can be seen, the class 30-40 contains the greatest number of values, followed by 40-50, 50-60, 20-30, 60-70, and 70-95.

Figure 13: Box plot quartiles

Figure 14: Box plot of age
the Q3 to Q1 interquartile range (As can be seen, 50% of values fall inside the interquartile range.)
(Q1) Lower Quartile
Using df1.age.describe(), the value of Q1 is estimated to be 33. This indicates that 24% of the clients in our sample are under the age of 33.
Average (Q2)
39 is the measured median value. Between Q1 and Q2, there are around 25% fewer clients. This indicates that 25% of the clients in our sample are between the ages of 33 and 39.
(Q3) Upper Quartile
Q3 has a computed value of 48. Between Q2 and Q3, there are around 25% fewer clients. This indicates that 25% of the clients in our dataset are between the ages of 39 and 48.
- Histogram & Box plots for the variable Balance

Figure 15: Histogram & Boxplot of balance distribution

Six classes are included in the histogram, as can be seen in the image above. Only the numbers between 0 and 25 have significant values. The values that follow index 25 are unimportant. From 25 indexes, six classes using function bins have been built.
The histogram shown above demonstrates that it is favorably skewed since the long tail is on the positive side of the peak. Histogram is skewed to the right because long tail is on right side of peak.
The balance column also has significant negative balance numbers. It can be inferred that consumers with negative balances may have obtained a credit card. As a result, the irregularity in the balance values has been taken into account when determining the median and quartiles.

Figure 16: Box plot of Balance distribution
- Histogram & Box plots for the variable Duration

Figure 17: Histogram & Boxplot of Duration distribution

The function bins have been used to construct six classes. The six classes are numbered 0 through 3025. The range between class 0 to 500 is where the highest values are consistently found. It has a 4400 mode value. It may be inferred that the histogram is positively skewed since its long tail is on the side of the positive peak. Its average duration is 242. We observe that the majority of values fall into the classes 0-500, as well as 500-1000, 1000-1500, 1500-2000, 2000-2500, and 2500-3025, respectively.

Figure 18: Box plot of variable Duration
Interquartile range = Q3-Q1 (it is clear that 50% of values fall inside this range).
(Q1) Lower Quartile
Q1’s value is 96 when using df1.duration.describe() to compute it. This indicates that 25% of the clients in our sample spoke for less than 96 seconds at the start of the campaign.
Average (Q2)
166 is the computed median value. Between Q1 and Q2, there are around 25% fewer clients. This indicates that 25% of the clients in our dataset spoke for between 96 and 166 seconds at the time of the campaign.
(Q3) Upper Quartile
Q3 has a computed value of 299 in it. Between Q2 and Q3, there are around 25% fewer clients. This indicates that 25% of consumers in our sample spoke for between 199 and 299 seconds at the time.
C. Count plot of job type with relation to term deposit


Figure 19: Count plot of job type vs term deposit
From the above figure, it can be seen that the majority of customers fall under the management job group, with the next highest percentages belonging to the blue-collar, technical, services, retired, jobless, student, entrepreneur, self-employed, housemaid, and unknown work categories.
As a result, the bank may target customers who are in management, blue-collar, technical, or administrative jobs. We can also see that the bank has had trouble attracting customers in the categories of business owners, housemaids, and those without jobs.
D. Bar graph of average balance of each age category
We must utilize the functions mean() and groupby() to calculate the balance average for each age group.


Figure 20: Bar graph of average balance of each age_category
The average balance is gradually growing in each class age category, according to the analysis of the bar graph shown above. This led to the conclusion that age_category and average_balance had positive relationships with one another. The age group will rise along with the balance.
Additionally, the value from class 50-59 expanded to the final class age group 80-100, as can be seen. This indicates that customers with superior average balances are often 50 years of age or older. As a result, the four classes included in the last have a greater average balance than the younger classes.
1) Further Analysis
- Diagram of Pair plot


Figure 21: Diagram of Pair plot
The results of the pair plot diagram are the same as those of the previously exhibited and discussed head map diagram.

The correlation values in the diagram above have been set to between -1 and 1. As can be seen, the variables that are negatively connected are lighter in shade than those that are favorably correlated. The association between the dark shade and the diagonal line with value 1 is also positive. Additionally, boxes with negative values and lighter shades have a negative connection.
In the image, when the value is closer to 0, there is not a linear association between the two variables. When the correlation is closer to 1, the variables are positively associated with one another. Therefore, if one rises, the other will as well. When the correlation values are near -1, they frequently exhibit similarities with one another. Last but not least, negative correlations frequently behave in an inverted manner. When one goes up, the others tend to go down.
- Bar plot diagram of balance per job type

Figure 22: Bar plot of balance per job type
Every employment type’s bank balance is displayed in the following diagram. A financial organization could wish to be aware of a customer’s employment details and bank account balance. Information of this kind is crucial to a financial institution’s ability to develop plans.
According to the above figure, the category labeled “retried” has the largest balance, followed by “management,” “self-employed,” “unknown,” and so on. Blue-color and services have the lowest balance of any category. Customer age and variable balance are connected. An elderly, blue-colored client will have more balance than a younger, red-colored consumer working in the management area. Therefore, they often have a negative association. If one rises, the other must fall.
- Bar plot diagram of housing loan per job type

Figure 23: Bar plot diagram of housing loan per job type
Every employment type’s home loan is displayed in the following diagram. A financial organization could wish to be aware of a customer’s employment details and bank account balance. Information of this kind is crucial to a financial institution’s ability to develop plans. The financial institution could be curious in the clientele who apply for mortgage loans based on their line of work.
According to the graphic above, the blue-collar group includes the majority of borrowers of home loans, then entrepreneurs, administrators, managers, technicians, the employed and jobless, students, housemaids, and so on. Additionally, a variable housing loan is tied to the customer’s age. For instance, a middle-aged consumer has a greater chance of obtaining a mortgage than a significantly older or younger one.
- Pie chart distribution as per Age Category

Figure 24: Pie chart distribution by age category
The proportion of customers are distributed according to age category, as shown in the above diagram. We can also see that the age_category 70-79 has the most customers, followed by 80-100, 60-69, 18-19, 20-25, 26-30, and so on.
Financial institutions might start and target the age range 70–79 in order to concentrate on their objectives and demands. Because it has the fewest customers, the category (42-49) must also be taken into account.
- Term deposit subscription by age category

Figure 25: Term deposit subscription by age category
The illustration above demonstrates that the older age groups (70-79, 80-100, and 60-69) have the most subscriptions since they have the most customers. The middle-aged folks don’t seem to be interested in term deposits. The financial institution may thus need to employ a variety of tactics and plans for those age groups.
Part 2 – Analysis of Livestock Data of Nepal
1) Data Understanding
Eight data sets containing information on the production of livestock and other goods in Nepal’s various regions and districts have been provided as part of this project. We will combine, clean up, and conduct an exploratory data analysis on those data in the part that follows.

horseasses-population-in-nepal-by-district.csv

| Column | Data type | Nullable | Description |
| district | object | non-null | different districts & regions list |
| horses/asses | int64 | non-null | population of horses/asses |
Table 1: horse-asses population in Nepal by district
milk-animals-and-milk-production-in-nepal-by-district.csv

| Column | Data type | Nullable | Description |
| district | object | non-null | names of district and regions |
| milking cows no | int64 | non-null | number of cows that give milk |
| milking buffaloes no | int64 | non-null | number of buffaloes that give milk |
| cow milk | int64 | non-null | volume cows’ milk produced (liters) |
| buff milk | int64 | non-null | volume buffs’ milk produced (liters) |
| total milk produced | int64 | non-null | volume total milk produced (cow+buff) |
Table 2: Milk animals & milk production in Nepal by district
net-meat-production-in-nepal-by-district.csv

| Column | Data type | Nullable | Description |
| district | object | non-null | names districts and regions |
| buff | int64 | non-null | total buff meat produced |
| mutton | int64 | non-null | total mutton meat produced |
| chevon | int64 | non-null | total chevon meat produced |
| pork | int64 | non-null | total pork meat produced |
| chicken | int64 | non-null | total chicken meat produced |
| duck meat | int64 | non-null | total duck meat produced |
| total meat | int64 | non-null | total sum all meat categories |
Table 3: Net meat production in Nepal by district
production-of-cotton-in-nepal-by-district.csv

| Column | Data type | Nullable | Description |
| district | object | non-null | d names istricts and regions |
| area (ha.) | int64 | non-null | total area used in hectare Cotton produces |
| prod (mt.) | int64 | non-null | total cotton production in metric ton |
| yield (kg/ha.) | int64 | non-null | total sum cotton yield |
Table 4: Production of cotton in Nepal by district
production-of-egg-in-nepal-by-district.csv

| Column | Data type | Nullable | Description |
| district | object | non-null | names districts and regions |
| laying hen | float64 | non-null | number egg laying hen |
| laying duck | int64 | non-null | number egg laying duck |
| hen egg | int64 | non-null | total egg produced by hen |
| duck egg | int64 | non-null | total egg produced by duck |
| total egg | int64 | non-null | total sum of egg produced |
Table 5: Production of egg in Nepal by district
rabbit-population-in-nepal-by-district.csv

| Column | Data type | Nullable | Description |
| district | object | non-null | names districts and regions |
| rabbit | int64 | non-null | population of rabbit |
Table 6: Rabbit population in Nepal by district
wool-production-in-nepal-by-district.csv

| Column | Data type | Nullable | Description |
| district | object | non-null | names districts and regions |
| sheep no | int64 | non-null | Numbers sheep |
| sheep wool produced | int64 | non-null | total wool produced |
Table 7: Wool production in Nepal by district
yak-nak-chauri-population-in-nepal-by-district.csv
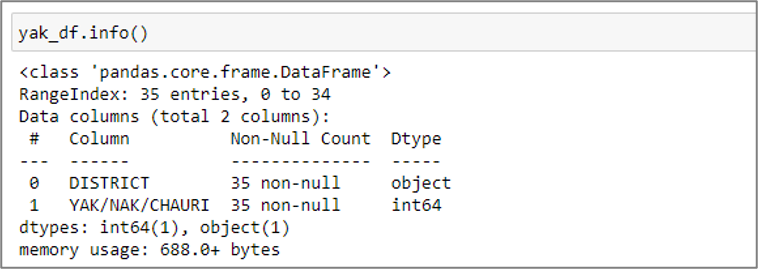
| Column | Data type | Nullable | Description |
| district | object | non-null | names districts and regions |
| yak/nak/chauri | int64 | non-null | population yak/nak/chauri |
table 26: Yak/Nak/Chauri population per region

Figure 27: Displaying 5 rows from every table
1) Data Merging and Cleaning
I discovered various errors and inconsistencies in the data after studying the data set. This can be the result of the challenges encountered when collecting site data.
horse data set Cleaning

milk data set Cleaning

meat data set Cleaning

rabbit data set Cleaning

yak data set Cleaning

all datasets Merging
The district column is a common one in the dataset. Through the use of a full outer join, the district column will be used to combine the entire dataset.

As a result, we integrated all datasets. The new data consists of 96 rows and 26 columns. The following information is provided on the kind of table data and the structure of new data. We have changed the nan values to 0 by using the method fillna(). It supports the precise and straightforward use of data analytics.
The amount of milk produced in total throughout Nepal is approximated using the total number of cows produced and their sum in each area.


2) Explanatory Data Analysis
Horse/Asses population by region

Figure 28: population per region of Horse/Asses
The total number of horses and asses in Nepal are depicted in the diagram above, broken down by area. The mid-western area is where there are the most horses and assessors, according to the diagram. Additionally, the central area has the lowest population of horses and asses.
We can infer that the mid-western region has a larger area than other regions. Overall, it comprises of remote parts of Nepal with no connectivity to highways. In order to go about, a lot of people utilize horses or assess.
Milk production by region

Figure 29: Milk production per region
We can observe the entire volume of milk produced across all of Nepal in the graphic above. The data analysis shows that the central region has the largest production, followed by the eastern, western, mid-western, and far-western regions.
Finally, it is clear that the far-western region is the smallest and most isolated from the other sections.
Meat production per region

Figure 30: Meat production per region
We can observe the total amount of meat produced in Nepal by region in the figure above. The data analysis shows that the central region has the largest production, followed by the eastern, western, mid-western, and far-western regions.
Because the far West is a smaller territory. As a result, they do not rely much on meat.
Cotton production per district

Figure 31: Cotton production per district
We can see the total amount of cotton produced in Nepal per district in the figure above. By examining the statistics, we can tell that the dang district, followed by the banke and bardiya regions, has the largest production.
Due to its excellent environment, the dang district is better appropriate for cotton growing.
Egg production per region

Figure 32: Egg production per region
We can observe the total quantity of eggs produced per region in Nepal in the figure above. The data analysis shows that the central region has the largest production, followed by the eastern, western, mid-western, and far-western regions.
Due to its larger population, the central area has a higher need for eggs.
Rabbit population per region

Figure 33: Rabbit population per region
We can observe the entire quantity of rabbit production per region in Nepal in the figure above. The data analysis shows that the midwestern region has the largest production, followed by the western, central, eastern, and far western regions.
Due to its demographic structure, the midwestern area is far better favorable for the production of rabbits.
Wool production per region

Figure 34: Wool production per region
We observe the total amount of wool produced in each area of Nepal in the figure above. The data analysis reveals that the midwestern area has the largest production, followed by the western, far western, eastern, and central regions.
Due to its population makeup, the Midwestern area is significantly better ideal for the manufacturing of wool.
Yak/Nak/Chauri population per region

Figure 35: Yak/Nak/Chauri population per region
The entire quantity of yak, nak, and chauri production by regions in Nepal is shown in the image above. The data analysis reveals that the eastern area has the largest production, followed by the mid-western, western central, and far-western regions.
Because of its inadequate transportation, the eastern area is far better ideal for yak, nak, and chauri production. People must therefore depend more on yak, nak, and chauri.
Similar to the MW. Region, the W. Region is home to some of the tallest mountains on earth. This explains the high yak population in these areas. The mountainous area is not very accessible to FW Region. As a result, there are not many yak, nak, or chauri living there.
References
Abhishek, S., 2020. analyticsvidhya. [Online] Available at: https://www.analyticsvidhya.com/blog/2020/02/joins-in-pandas-master-the- different-types-of-joins-in-python/
[Accessed 21 January 2022].
Avantika, M., 2022. simplilearn. [Online] Available at: https://www.simplilearn.com/data-science-vs-big-data-vs-data-analytics- article#what_is_data_analytics
[Accessed 14 Januray 2022].
geeksforgeeks, 2021. geeksforgeeks. [Online] Available at: https://www.geeksforgeeks.org/python-pandas-dataframe-isin/ [Accessed 21 January 2022].
JavaTpoint,
Available sum#:~:text=sum()%20function%20is%20used,the%20values%20in%20each%20column. [Accessed 22 January 2022].
2022. JavaTpoint. [Online] at: https://www.javatpoint.com/pandas-
Appendix
- What is Term Deposit?
Term deposits are fixed-term investments made when funds are put into a bank account. Term deposits typically have short maturities, ranging from a month to a few years.

CC7169NI Software Project Management – 50% Group Coursework


Contents
Chapter 1: Memorandum…………………………………………………………………………………………….. 1
Chapter 2: Methodologies……………………………………………………………………………………………. 3
2.1. Software development approach…………………………………………………………………………. 3
Chapter 3: RACI Matrix……………………………………………………………………………………………. 16
3.1 RACI Matrix on Activity Level…………………………………………………………………………. 16
Chapter 4: Project Plan……………………………………………………………………………………………… 20
Chapter 5: Project Brief…………………………………………………………………………………………….. 30
- Project Definition…………………………………………………………………………………………….. 30
Chapter 6: PRINCE 2 and DSDM………………………………………………………………………………. 38
References……………………………………………………………………………………………………………….. 49
APPENDIX:……………………………………………………………………………………………………………. 51
Budget Calculation:………………………………………………………………………………………………. 51
Originality Report…………………………………………………………………………………………………….. 52
TABLE OF FIGURES
Figure 1: Traditional Software Development Approach………………………………………………….. 3
Figure 2: Agile Software Development Approach………………………………………………………….. 4
Figure 3: Traditional VS Agile Software Development Approach……………………………………. 5
Figure 4: Scrum Methodology……………………………………………………………………………………… 6
Figure 5: Scrum Artifacts……………………………………………………………………………………………. 7
Figure 6: Scrum Ceremonies……………………………………………………………………………………….. 8
Figure 7: Scrum Team………………………………………………………………………………………………… 8
Figure 8: DSDM principles……………………………………………………………………………………….. 10
Figure 9: Phases of DSDM………………………………………………………………………………………… 11
Figure 10: DSDM Project Management Roles……………………………………………………………… 12
Figure 11: Team Structure…………………………………………………………………………………………. 20
Figure 12: PRINCE2 environment……………………………………………………………………………… 38
Figure 13: PRINCE2 project lifecycle…………………………………………………………………………. 40
Figure 14: PRINCE2 and DSDM comparison………………………………………………………………. 41
TABLE OF TABLES
Table 1: Selection of DSDM Explanation 1…………………………………………………………………. 13
Table 2: Selection of DSDM Explanation 2…………………………………………………………………. 13
Table 3: Selection of DSDM Explanation 3…………………………………………………………………. 13
Table 4: Selection of DSDM Explanation 4…………………………………………………………………. 14
Table 5: Selection of DSDM Explanation 5…………………………………………………………………. 14
Table 6: Rejection of Scrum Explanation 1………………………………………………………………….. 14
Table 7: Rejection of Scrum Explanation 2………………………………………………………………….. 14
Table 8: Rejection of Scrum Explanation 3………………………………………………………………….. 15
Table 9: Rejection of Scrum Explanation 4………………………………………………………………….. 15
Table 10: RACI Matrix on Activity Level…………………………………………………………………… 16
Table 11: Team Role Description……………………………………………………………………………….. 20
Table 12: User Stories………………………………………………………………………………………………. 21
Table 13: Prioritization and Estimation……………………………………………………………………….. 23
Table 14: Time Box 1 planning………………………………………………………………………………….. 24
Table 15: Time Box 2 planning………………………………………………………………………………….. 25
Table 16: Project Plan……………………………………………………………………………………………….. 25
Table 17: Components and Descriptions……………………………………………………………………… 31
Table 18: Differences between PRINCE2 and DSDM………………………………………………….. 41
Table 19: Probing at Process Level…………………………………………………………………………….. 42
Table 20: Probing in Roles………………………………………………………………………………………… 43
Table 21: Probing at Deliverables………………………………………………………………………………. 45
Chapter 1: Memorandum
To: Board Members, SoftTech Services Inc.
From: Roshan Sah, Project Manager
Date: May 16, 2022
Subject: Regarding the formation of the Project management Team
Dear sir/madam,
The goal of this memorandum is to define the different project processes and strategy for the creation of a new product, “Book My Show,” an online cinema booking system. This project intends to include a variety of features that will give consumers with a nice online ticketing experience, as well as a feedback mechanism to help improve events. The project timeline, cost estimates, and timetable will be discussed, as well as communication systems and the project team.
SoftTech Services Inc. is a multinational corporation with development facilities in the United States, India, and Nepal. The “Book My Show” project’s major goal is to give users with the ability to book movie tickets as well as a number of additional services that create a good detailed experience. It contains a feedback mechanism and offers a ticket booking service that can be used by uploading movie materials. Based on user data with the development team and other project team members regarding development approaches, we’ve decided that the Agile Approach is ideal for this project because agile ensures constant stakeholder management, consistent communication, continuous cooperation and feedback conferences. We will employ the DSDM Methodology throughout the project because it is an agile framework. We also utilize Prince2 since it is a procedure-based approach to project management that gives us a lot of control over project resources while also supporting us with project and project risk management.
Our project will begin on June 1, 2022 and is expected to be finished by December 1, 2022. The project’s projected budget is $675,500, which includes costs for tools, operations, and resources; more information is provided in the “Appendix” section of this report. This report’s “4.5 Project Plan” section details the project’s team organization. As project managers, we prioritize all team members. The organization of the team members is described in the “4.1 Team Structure” section of this report. The RACI matrix, which is also included in this paper, will be used to identify the communication channel and the duties of team members. As project manager, I’ll be in charge of weekly meetings with the whole team and the board of directors to review project progress, as well as keeping track of any progress and difficulties that occur during the project’s development.
Chapter 2: Methodologies
2.1. Software development approach
The software development methodology refers to the techniques and procedures used to create, plan, test, manage, deploy, and design safe software products (AcqNotes, n.d.). Choosing the appropriate strategy might make or break your chances of success. Software development may be divided into two approaches:
1. Traditional Software Development Approach
The traditional approach to software development is a linear strategy in which the development process is finished sequentially with a complete set of requirements. The preceding step must be completed before going on to the next. If an issue emerges throughout the development of a project, it must go through the commencing phase. The approach is regarded as a heavyweight because of its weight. Because of its low change rate, this technique was irritating and difficult to employ until 1975, when a new approach known as the Agile Approach was established (Pankaj, 2019). Waterfall, Spiral Model, V-Model, and other conventional techniques are examples.

Figure 1: Traditional Software Development Approach
The phases of the conventional Software Development Approach are outlined above, and it also demonstrates that the traditional Software Development Approach is suitable for projects with well-defined standards and needs.
2. Agile Software Development Approach
Agile software development is a software development process that prioritizes communication, cooperation, task timeboxing, and the ability to react to change fast. Agile software development is an iterative method that divides projects into shorter sprints (Mavuru, 2018). Because agile is more adaptive in terms of specification changes and additions than traditional techniques, less time is spent on strategic prioritizing and planning. Extreme Programming (XP), Scrum, Dynamic System Development Method (DSDM), and other Agile methodologies are examples.

Figure 2: Agile Software Development Approach
The diagram above depicts agile workflow. The agile software development approach is significantly more flexible than traditional software development techniques when it comes to making adjustments to a process or a product (Kashyap, n.d.). As a result, agile software development is well-suited to a continually changing project or firm.
Comparison between Traditional and Agile Software Development Approaches Both traditional and agile techniques have benefits and drawbacks. Depending on the demands of the stockholders, the project might be developed in any way. The software development strategy used depends on the project size, the people involved, and the risk factor (Mavuru, 2018).
| Characteristics | Agile approach | Traditional approach |
| Organizational structure | Iterative | Linear |
| Scale of projects | Small and medium scale | Large-scale |
| Management Style | Decentralized | Autocratic |
| Perspective to Change | Change Adaptability | Change Sustainability |
| User requirements | Interactive input | Clearly defined beforeimplementation |
| Emphasis | People-Oriented | Process Oriented |
| Involvement of clients | High | Low |
| Development model | Easily changeable | Fixed |
| Test documentation | Comprehensive test planning | Tests are performed one at atime. |
| Effort estimation | Scrum master facilitates and the team does the estimation | Project manager provides estimates and gets approval from PO for the entire project(Kashyap, n.d.). |
| Restart Cost | Low | High |
| Testing | Every iteration | Once coding is done |
| Reviews and approvals | Reviews are done after each iteration | Excessive reviews and approvals by leaders |

Figure 3: Traditional VS Agile Software Development Approach
2.2 Selection of Methodologies
The process used by software development teams is referred to as software development methodology. It is used to create and deploy many types of software applications while maintaining requirements, adhering to dates and timelines, reducing risk, and giving value to clients. I chose two software development strategies for numerous Agile approaches to project development, which are briefly outlined below with comparisons.
2.2.1 Scrum Methodology
Scrum technique is a software development framework for managing iterative and progressive project development. In 1986, Hirotaka Takeuchi and Ikujiro Nonaka defined it as “a flexible, holistic product development technique where a development team works as a unit to achieve a single goal” in the New Product Development Game (Sachdev, 2016).
A product is broken down into smaller jobs, which are then grouped into a backlog. The tasks in a sprint are completed in the order listed in the backlog.

Scrum Artifacts:
Artifacts are used by the scrum team to solve problems. They are the constants in a scrum team, revisited and invested in on a frequent basis (ALLIANCE, n.d.). They are as follows:
- Product Backlog
- Sprint
- Increment

Figure 5: Scrum Artifacts
Scrum Ceremonies:
Scrum ceremonies are a series of activities that the scrum team performs on a regular basis (Paradigm, n.d.). It makes certain that everything is done appropriately. The scrum ceremonies are listed below.
- Sprint planning
- Daily Serum or Stand Up
- Sprint Review
- Sprint Retrospective
Scrum Team:

Figure 6: Scrum Ceremonies
A Scrum Team is a collection of individuals who collaborate to produce the needed product increments (Paradigm, n.d.). The Scrum framework encourages team members to communicate effectively. Scrum teams consist of:
- Product Owner
- Scrum Master
- Development Team

Figure 7: Scrum Team
2.2.2 Dynamic System Development Method (DSDM)
In 1994, information system professionals from various industries teamed up with consultants and project managers from some of the largest IT firms to form a non-profit Consortium dedicated to understanding and defining best practices in application development so that they can be widely taught and implemented (Stapleton, n.d.). The result is the Dynamic System Development Method (DSDM), which describes project management, estimating, prototyping, timeboxing, configuration management, testing, quality assurance, role and responsibilities, team structures, tool environment, risk management, building for maintainability and reuse, and vendor/purchaser relationships in a RAD (Rapidly Achieving Disaster) environment (RENDER, 2018). It is an Agile technique that addresses both the project’s lifespan and its commercial effect.
The synergistic value of the DSDM principles enables organizations to develop the greatest value business solution (RENDER, 2018). DSDM has eight principles, which are listed below:
- Focus on business need
- Deliver on time
- Collaborate
- Never compromise quality
- Build incrementally from firm foundations
- Develop iteratively
- Communicate continuously and clearly
- Demonstrate control

Figure 8: DSDM principles
DSDM presents a six-phase framework that depends on a number of methodologies based on the aforementioned concepts (RENDER, 2018). The stages are listed below:
- Pre-project
This phase ensures that the initiatives are arranged around a clear aim. Before starting the feasibility stage of the project, ensure that all resources are available. It acts as an entrance point, ensuring that projects are ready to begin based on the target and business objectives.
- Feasibility
During this phase, it must be determined whether the proposed project is technologically viable and cost-effective from a market standpoint. The time spent on Feasibility should be sufficient to determine if more study is required or whether the project should be abandoned immediately because completion is unattainable (Business, n.d.).
- Foundation
In this stage, you expand on the work you accomplished in Feasibility. You get a foundational understanding of the organization’s requirements and how this project fits those criteria. The purpose is to get a sense of the project’s scope of work and provide the framework for defining it, as well as estimations for finishing project components, using ranging estimations if appropriate.
- Evolutionary Development
After you’ve created a solid basis for the project, you should be ready to begin the iterative development cycle. The best answer should emerge over time. Timeboxing is used in Evolutionary Development to regulate iterations, with each iteration delivering a finalized component of a much bigger whole. Each timed iteration can use MoSCoW prioritization to prioritize the things to be worked on (your iteration backlog).
- Deployment
The Deployment phase’s goal is to put a baseline model of the Emerging Solution into production (Business, n.d.). The distributed release may include the whole solution or only a piece of it. In the Deployment phase, the three most important tasks are to assemble, review, and deploy. Furthermore, with the latest release, the project is officially closed.
- Post-project
After the product is developed, maintenance will surely be necessary. Maintenance is typically performed in a cycle similar to that used to manufacture the product.

Figure 9: Phases of DSDM
Because the DSDM focuses on the product supplied often in each iteration, these stages are aided by a number of key strategies. They’re:
- The Timeboxing
- The MoSCoW prioritization
- Facilitated workshops
- Iterative development
- Modeling and prototyping techniques
DSDM Project Management Roles and Responsibilities
The jobs in DSDM are more akin to those in a waterfall technique. DSDM has three tiers of role classifications. The three are indeed the project level, the solution team working, and the support team (RENDER, 2019). Each project phase has a project’s main team and a solution development team.

Figure 10: DSDM Project Management Roles
Orange represents roles that promote commercial interests. Green represents the technical contributors to the solution’s technical components. The color blue signifies the administration and leadership of the project. Gray represents the procedural interests of the project that contribute in its execution (RENDER, 2018).
2.2.1 Selection of DSDM
Out of the two approaches, DSDM is the best match for this project. I picked the DSDM technique for a variety of reasons, which are detailed here.
Table 1: Selection of DSDM Explanation 1
| Explanation 1 | |
| Scenario | The priority function of the product will be supplied at the start of the project, when the work is completed in accordance with the product’s prototype feature. |
| Attribute | Methodology was included in prototyping and timeboxing. |
| Reasoning | The DSDM approach prioritizes critical functionality, allowing problems to be recognized early in the development process and early deliverables to be utilized to collect user input. |
Table 2: Selection of DSDM Explanation 2
| Explanation 2 | |
| Scenario | As a project manager, I must provide a specific timeline for the completion of each project component, as well as a cost-effective budget division plan. |
| Attribute | Strict time and budget constraints. |
| Reasoning | Declaring a specified development timetable and allocating appropriate funding raises the product’s value. |
Table 3: Selection of DSDM Explanation 3
| Explanation 3 | |
| Scenario | Stakeholder-required aspects must be incorporated in the initial development stage, while certain unwanted parts can be disregarded. Following that, other features can be implemented. Collaboration among team members on each feature may increase the value of the product. |
| Attribute | Stakeholders are invited to participate in the development process. |
| Reasoning | Collaboration and collaboration among all involved parties assist in achieving the intended result. |
Table 4: Selection of DSDM Explanation 4
| Explanation 4 | |
| Scenario | The product’s excellence must be beneficial for both the stakeholder and the firm to meet the criteria of the current product selection. |
| Attribute | The emphasis is on testing. |
| Reasoning | Testing is performed at every stage of the development process to ensure that the product is technically sound and free of faults. |
Table 5: Selection of DSDM Explanation 5
| Explanation 5 | |
| Scenario | To fulfill the business purpose, the product must give a good outcome with a well-experienced and competent team member. |
| Attribute | Team members that are business-oriented and empowered. |
| Reasoning | Experienced team members provide a high-quality product that increases the company’s capacity to meet its needs. |
2.2.1 Rejection of Scrum
I rejected the Scrum technique due to various disadvantages in terms of the project goals, the reasons are given below.
Table 6: Rejection of Scrum Explanation 1
| Explanation 1 | |
| Scenario | An adequate timeframe for product completion is required to preserve company value and stakeholder expectations. |
| Attribute | Adherence to time and budget. |
| Reasoning | Scope creep may develop due to the lack of a specified end-date, decreasing the company’s worth. |
Table 7: Rejection of Scrum Explanation 2
| Explanation 2 | |
| Scenario | SoftTech Services Inc. is a multinational corporation that collaborates with a variety of stakeholders. |
| Attribute | Suitable for large-scale projects. |
| Reasoning | Scrum is best suited to short, fast-paced projects, but it is ineffective for bigger ones. |
Table 8: Rejection of Scrum Explanation 3
| Explanation 3 | |
| Scenario | Each team member must be consistent in order for the project to be successful. The loss of a technical staff member in a specific component of the product may limit its features. |
| Attribute | Collaboration amongst team members. |
| Reasoning | Uncertainty among team members for many causes may render the development process and the ultimate product worthless. Collaboration between them may be unsatisfactory. |
Table 9: Rejection of Scrum Explanation 4
| Explanation 4 | |
| Scenario | Testing at each stage of completion may result in more convenient goods by decreasing technical issues.. |
| Attribute | It is difficult to produce a high-quality product. |
| Reasoning | If the product is tested in a lesser amount, it may have technical concerns. Unless the team goes through a rigorous testing procedure, the output may not meet the needs of the firm and stakeholders. |
2.2.2 Conclusion
Because this is a large-scale project, a good development methodology that adds value to the product while staying on time is required. For the completion of this project, the DSDM technique was chosen over Scrum. DSDM prioritizes business objectives, completes activities on schedule and at a predictable rate, and iterates through ongoing communication. Before the project begins, DSDM conducts a detailed feasibility analysis and planning to aid in the understanding of the scope and features of the intended product. With the required inputs, this process assures the features with the technically sound output. It also enables flexible work environments where achieving deadlines and producing high-quality products are key concerns. Collaboration among stakeholders decreases complexity, resulting in a high-quality outcome. The DSDM’s prototyping and timeboxing capabilities increase the product’s value.
Chapter 3: RACI Matrix
The RACI Matrix is a technique for describing the roles and responsibilities of several persons or departments in the execution of a job or the delivery of a Quality Improvement project. Clearing responsibilities in a project can serve to reduce confusion and offer an answer to the question, “Who’s doing what?” RACI is an acronym that stands for Responsible, Accountable, Consulted, and Informed (SANTOS, 2021).
The letters in the RACI matrix represent a project’s task level, as indicated below. This team member is in charge of completing the assignment.
Accountable: This individual examines the assignment before to completion.
Before the job is signed off, this individual must be approached for the necessary inputs and permission.
Informed: This team member must maintain all project information up to date.
3.1 RACI Matrix on Activity Level
The RACI Matrix of the activities of DSDM with the project roles is mapped below.
Table 10: RACI Matrix on Activity Level
| Roles | Project Level | Solution Development Level | Support Level | ||||||||||
| Activities | Business Sponsor | Business Visionary | Technical Co- Ordinator | Project manager | Business Analyst | Team Leader | Solution developer | Solution Tester | Business Ambassador | Technical Advisor | Business Advisor | Workshop Facilitator | Agile Coach |
| 1. Pre-project | |||||||||||||
| 1.1 Identifying Role | R/A | C | C | R/C | |||||||||
| 1.2 Term of Reference | A | C | C | R | C | ||||||||
| 2. Feasibility Analysis | |||||||||||||
| 2.1 Feasibility Assessment | A/C | C | C | R | R | I | C | C | C | ||||
| 2.1.1 Identify Benefit | A/C | C | C | R | R | I | C | C | C | ||||
| 2.1.2 Estimate Cost and Time | A/C | C | C | R | R | I | C | C | C | ||||
| 2.1.3 Outline Solution | A/C | C | C | R | R | I | C | C | C | ||||
| 2.2 Outline Plan | A | C | C | R | C | ||||||||
| 3. Foundation | |||||||||||||
| 3.1 Determine Business Case | R/A | R | C | C | R | C | C | ||||||
| 3.2 Describe and prioritizedrequirements | R/A | C | R | I | I | I | C | C | |||||
| 3.3 Solution ArchitectureDefinition | A | R | C | R/A | I | C | C | ||||||
| 3.4 DevelopmentArea Definition | |||||||||||||
| 3.4.1Solution Review Strategy | R/A | C | C | C | I | I | I | C | C | ||||
| 3.4.2 Solution DevelopmentStandards | R | A | C | C | C | C | C | C | |||||
| 3.5 ManagementArea Definition | A | C | C | R | C | C | C | ||||||
| 3.6 Create Deliveryplan | I | A | C | R | C | C | C | C | C | ||||
| 3.7 Identify Delivery Management Techniques | A | C | C | R | C | I | I | I | I | C | C | ||
| 4. Evolutionary Development | |||||||||||||
| 4.1 Elaborate PRL | C | R | R/A | C | C | C | |||||||
| 4.2 Planning Timebox | A | A | R | R | R | R | |||||||
| 4.3 Creating Functional Solution | I | I | I | C | R/A | R/A | R | I | C | C | C | ||
| 4.4 Solution Testing | |||||||||||||
| 4.4.1 Business Acceptance Testing | I | I | C | R/A | R | R | |||||||
| 4.4.2 TechnicalTesting | I | I | R/A | I | R | ||||||||
| 4.5 Planning Development Phase | I | I | C | R | C | A | C | C | |||||
| 4.6 End of Timebox Assessment | I | C | R/A | R | R | ||||||||
| 5. Deployment | |||||||||||||
| 5.1 Deploy Solution | A | C | I | I | R | R | R | R | C | C | |||
| 5.2 End of ProjectAssessment | A | C | C | R | C | C | R | R | |||||
| 6. Post Project | |||||||||||||
| 6.1 Benefits Assessment | A | R | R | C | C |
Pre-Project
The Business Sponsor determines the project management roles. The Business Sponsor is in charge of working with the Project Manager and Business Analyst to develop the terms of reference.
Feasibility
The Business Analyst is in charge of conducting feasibility analyses, which include cost, budget, and timetable estimates. After engaging with all project partners, a Business Sponsor certifies the feasibility study’s completion. Some of the suggestions are also provided by Business Ambassadors and Advisors. The project manager is in charge of developing a strategy based on the feasibility evaluation.
Foundation
The Business Case will be delivered by all project-level people, with help from the Business Analyst, Ambassador, and Advisor. The Business Analyst creates the PRL, which is authorized by the Business Visionary, to ensure that the requirements are in accordance with the business vision and that the Project Team is aware of it. With the assistance of Business Level People, the Business Analyst defines the Solution Architecture. The technical coordinator creates a Solution Development Standard and a review procedure with the assistance of the Solution Development Team. The Delivery Management Techniques are tracked by the Project Manager and Business Analyst, while the Technical Team develops the delivery plan.
Evolutionary Development
The Solution Development Team prepares the timeframes for designing, building, and documenting the product throughout this phase. They are completely in charge of the product’s development. The Project Manager is brought up to date on the status of the work. Solution Tester creates and tests the Business Acceptance Tests Plan with the assistance of the Business Analyst. The Project Manager creates Development Plans with the assistance of the Development Team and Technical Coordinator, which are subsequently presented with the Project Board.
Deployment
The product is deployed by the Solution Development Team, who are overseen by the Project Sponsor. Finally, the Project Manager facilitates a review with the Solution Development Team. The project is evaluated at the conclusion by the Project Manager, Solution Developer, and Solution Tester, with input from the Technical Coordinator, Business Visionary and Business Analyst.
Post Project
During this phase, the Business Visionary and Business Analyst examine the advantages of the solution implemented in consultation with the Business Ambassador and Business Advisor.
Chapter 4: Project Plan
4.1 Team Structure

4.1.1 Team Role Description
Table 11: Team Role Description
| Board | Organizational Role | Project Role |
| Michael Bedford | Chief Executive Officer | Business Sponsor |
| Robert Williams | Chief Operating Officer | |
| Ben Kasper | Chief Financial Officer | |
| Julia Stephenson | Chief HR officer | |
| Kevin Wilson | Chief Technology Officer | Technical Coordinator |
| Howles Buffet | President – USA | |
| Pramod Thapa | President – Nepal | |
| Abdul Khan | President – India | |
| Kyle Jones | Director of ProjectManagement | Business visionary |
| Helen Peterson | Director of Sales and Marketing | |
| Roshan Sah | Project Manager |
Michael Bedford, the company’s Chief Executive Officer, will serve as the Business Sponsor for this initiative. Robert Williams is the company’s Chief Operating Officer, and he is in charge of directing the company’s day-to-day administrative and operational tasks. Ben Kasper and Julia Stephenson are the Chief Financial Officer and Chief Human Resources Officer, respectively, in charge of financial and human resource oversight. Kevin Wilson, the project’s Chief Technology Officer, will oversee the project’s technical components and act as the Technical Coordinator. Kyle Jones, the director of project management, will be the business visionary in charge of providing the project with long-term vision. The president of the United States is Howles Buffet, while the presidents of Nepal and India are Pramod Thapa and Abdul Khan, respectively. I am the Initiative Manager for this project, reporting directly to the President of Nepal. The Solution development team and Group Leader will report to me on a regular basis regarding the project’s progress and management. With the assistance of these team representatives, the project will realize the Business Visionary’s vision.
4.1 User Stories:
| User StoryID | As a… | I want… | So that… |
| 1 | User | To create my own account. | I can log in to see movie shows & details. |
| 2 | User | View and choose movie from different categories. | I can book any movie and buy tickets. |
| 3 | User | Buy a movie ticket. | I can purchase movie directly from app. |
| 4 | User | Book a seat. | I can book any available seat easily without having to pay. |
| 5 | User | Search for a show. | I can find the show I desired easily. |
| 6 | User | View ongoing, upcoming and watched movies. | I can keep track of my progress and achievements. |
| 7 | User | Watch trailer of movie. | I can watch and decide efficiently. |
| 8 | User | Download ticket, booked transcripts of a movie | I can save on device and show it later. |
| 9 | User | Booking screen | I can see available seats and book it. |
| 10 | User | See watched movie. | I can keep track of my progress. |
| 11 | User | Submit reviews & rating. | I can rate, review and share feedback. |
| 12 | User | Multiple payment option | I can make payments seamlessly through a number of channels. |
| 13 | User | Logout & delete account | I can easily logout and also delete account when I desire. |
| 14 | Admin | Create shows content | I can create new content which user can see and book movie. |
| 15 | Admin | Edit shows content. | I can edit content with responses to feedback and keep it updated. |
| 16 | Admin | Upload videos and details in a shows. | Every single one of user can get access to trailer and movie details. |
| 17 | Admin | Create reviews checker | Everyone in the app can write reviews and rating. |
| 18 | Technical coordinator | See the platform handles more than 100,000 users using it at a time with no compromise. | It can be scalable and take huge loads at a time in busy hours. |
| 19 | Technical coordinator | Should support on iOS and Android platform | It is platform-efficient for employees and users, and it improves software usability. |
| 20 | Technical coordinator | Have a disaster recovery plan. | Technical officials can quickly tackle the disaster’s damages. |
| 21 | Manager | Make a system to send an email to users on posts and submissions. | It serves as a reminder to users about articles and submissions that have received feedback. |
4.2 Prioritization and Estimation
By prioritizing project deliverables to meet the demands of stakeholders, DSDM determines the cost, quality, and timeliness of each project. The key principle of the method is to provide business-oriented goods in a timely and high-quality way.
MoSCoW prioritization is a prominent and widely used requirement management prioritizing approach. In order for MoSCoW prioritization to be effective, work must be time-boxed, with an emphasis on business goals and product deadlines. This strategy is frequently used to assist key stakeholders in understanding the impact of actions in a certain release. MoSCoW is an abbreviation that stands for four categories of initiatives: must, should, could, and will not have (Chisel, n.d.).
- Must-Have:
The team must meet non-negotiable product requirements.
- Should Have:
Important projects that aren’t critical yet bring a lot of value.
- Could Have:
It’s nice to have projects that, if ignored, will have a minor influence.
- Will not have:
Initiatives that are not a priority for this time period.
Table 13: Prioritization and Estimation
| Priority | ID | User Stories |
| M01 | As a user, I want to create my own account. | |
| Must have | M02 | As a user, I want to View and choose movie from different categories. |
| M03 | As a user, I want to buy a movie ticket. | |
| M04 | As a user, I want to book a seat. | |
| M05 | As a user, I want to search for a show. | |
| M06 | As a user, I want to view ongoing, upcoming and watched movies. | |
| M07 | As an admin, I want to Create show content | |
| M08 | As an admin, I want to edit my show content | |
| M09 | As an admin, I want to upload videos and details in a shows. | |
| Should have | S01 | As a user, I want to view movie show and its prices. |
| S02 | As a user, I want to logout & delete account | |
| S03 | As a user, I want to submit review and rating. | |
| S04 | As a user, I want multiple payment option. | |
| C01 | As a user, I want to download ticket, booked transcripts of a movie |
| Could have | C02 | As a technical coordinator, I want to see the platform handles more than 100,000 users using it at a time with no compromise. |
| C03 | As a technical coordinator, I want the have a disaster recovery plan | |
| C04 | As a technical coordinator, I want have app that support on iOS and Android platform | |
| C05 | As a user, I want to recommend movie to a friend. | |
| Will not have | W01 | The system won’t have a web application. |
| W02 | The system won’t have the option to download videos or any files and files of the movie. |
4.3 Timebox Planning
Time Box 1 planning
| ID | User Story | MoSCoW | Remarks |
| M01. | As a user, I want to create my own account. | Must Have | |
| M02. | As a user, I want to view and choose movie from different categories | Must Have | |
| M03. | As a user, I want to buy a movie ticket. | Must Have | |
| M04. | As a user, I want to book a seat. | Must Have | |
| M05. | As a user, I want to search for a show. | Must Have | |
| M06. | As a user, I want to view ongoing, upcoming and watched movies. | Must Have | |
| M07. | As an admin, I want to create shows content | Must Have | |
| M08. | As an admin, I want to edit my shows content | Must Have | |
| M09. | As an admin, I want to upload videos and details in a shows. | Must Have |
Objective: To construct a working product in which students may establish their own accounts, view, choose, purchase, join, search, download tickets, and watch teaser videos, and trainers can create, modify, and post show content materials.
Time Box 2 planning
| ID | User Story | MoSCoW | Remarks |
| S01 | As a user, I want to view movie show and its prices. | Should Have | |
| S02 | As a user, I want to logout & delete account | Should Have | |
| S03 | As a user, I want to submit review and rating. | Should Have | |
| S04 | As a user, I want multiple payment option. | Should Have | |
| C01 | As a user, I want to download ticket, booked transcripts of a movie | Could Have | |
| C02 | As a technical coordinator, I want to see the platform handles more than 100,000 usersusing it at a time with no compromise. | Could Have | |
| C03 | As a technical coordinator, I want the have a disaster recovery plan. | Could Have | |
| C04 | As a technical coordinator, I want have app that support on iOS and Android platform | Could Have | |
| C05 | As a user, I want to recommend movie to a friend. | Could Have |
Objective: Adding features that allow students to keep track of their progress, take tests and submit assignments, offer comments, suggest the shows to a friend, and participate in the shows forum and respond to others’ postings. A technical coordinator may handle over 100,000 users, as well as catastrophe recovery and a maximum response time of 5 seconds.
4.4 Project plan
| S.N. | Activity | Deliverables | Start Date | End Date | Durati on | Resources |
| 1 | Pre-Project | Term ofReference | 2022/05/06 | 2022/05/08 | 3 | |
| 1.1 | Identify Roles | 2022/05/06 | 2022/05/07 | 2 |
| 1.2 | Prepare Term of Reference | 2022/05/08 | 2022/05/08 | 1 | BusinessSponsor | |
| 2 | Feasibility | Multiple | 2022/05/09 | 2022/05/15 | 5 | |
| 2.1 | Feasibility Assessment | Feasibility Assessment Document | 2022/05/09 | 2022/05/14 | 4 | Business Analyst, BusinessSponsor |
| 2.1.1 | Identify Benefit | 2022/05/09 | 2022/05/09 | 1 | ||
| 2.1.2 | Estimate Cost andtime | 2022/05/10 | 2022/05/13 | 2 | ||
| 2.1.3 | Outline Solution | 2022/05/14 | 2022/05/14 | 1 | ||
| 2.2 | Outline Solution | Outline PlanDocument | 202/05/15 | 2022/05/15 | 1 | ProjectManager |
| 3 | Foundation | 2022/05/16 | 2022/05/29 | 10 | ||
| 3.1 | Determine Business Case | Business Case Document | 2022/05/16 | 2022/05/16 | 1 | Business Visionary, Sponsor |
| 3.2 | Describe &prioritize requirements | PrioritizedRequirement List | 2022/05/17 | 2022/05/20 | 2 | Business Visionary |
| 3.3 | Create Solution Architecture Definition | Solution Architecture Definition | 2022/05/21 | 2022/05/21 | 1 | Business Analyst |
| 3.4 | Development AreaDefinition | SolutionFoundation | 2022/05/22 | 2022/05/23 | 2 | |
| 3.4.1 | Solution Review Strategy | 2022/05/22 | 2022/05/22 | 1 | Technical Coordinator, BusinessAnalyst | |
| 3.4.2 | Solution DevelopmentStandards | 2022/05/23 | 2022/05/23 | 1 | Technical Coordinator | |
| 3.5 | Management Area Definition | ManagementFoundation Document | 2022/05/24 | 2022/05/24 | 1 | Project Manager |
| 3.6 | Create Delivery Plan | Delivery Plan | 2022/05/27 | 2022/05/28 | 2 | Project Manager, BusinessVisionary |
| 3.7 | Determine Delivery ManagementTechniques | Delivery Control Pack | 2022/05/29 | 2022/05/29 | 1 | |
| 4 | Evolutionary Development | Multiple | 2022/05/30 | 2022/05/10 | 160 | |
| 4.1 | TIMEBOX 1 | Objective | 2022/05/30 | 2022/05/26 | 20 | |
| 4.1.1 | Elaborate PRL | 2022/05/30 | 2022/05/30 | 1 | Project Manager | |
| 4.1.2 | Planning Timebox | Timebox Plan, Timebox ReviewRecord | 2022/05/31 | 2022/05/31 | 1 | Team Leader |
| 4.1.3 | Creating Functional Solution | Evolving Solution, SupportingDocumentation | 2022/06/03 | 2022/06/13 | 9 | Solution Development Team |
| 4.1.4 | Solution Testing | SolutionAssurance Pack | 2022/06/14 | 2022/06/21 | 6 | Solution Testing Team |
| 4.1.4.a | Business Acceptanc e Testing | 2022/06/14 | 2022/06/18 | 3 | Team Leader, SolutionTester | |
| 4.1.4.b | Technical Testing | 2022/06/19 | 2022/06/21 | 3 | Team Leader, SolutionTester | |
| 4.1.5 | Planning Deployment Phase | Deployment Plan | 2022/06/24 | 2022/06/24 | 1 | Project Manager |
| 4.1.6 | Deployme nt | 2022/06/25 | 2022/06/26 | 2 | ||
| 4.1.6.a | Deploy Solution | Deployed Solution | 2022/06/25 | 2022/06/25 | 1 | Solution DevelopmentTeam |
| 4.1.6.b | End of Timebox Assessment | Timebox Retrospective Report | 2022/06/26 | 2022/06/26 | 1 | Project Manager |
| 4.2 | TIMEBOX 2 | 2022/06/27 | 2022/07/23 | 20 | ||
| 4.3 | TIMEBOX 3 | 2022/07/24 | 2022/08/23 | 20 | ||
| 4.4 | TIMEBOX 4 | 2022/08/24 | 2022/09/20 | 20 | ||
| 4.5 | TIMEBOX 5 | 2022/09/21 | 2022/10/18 | 20 | ||
| 4.6 | TIMEBOX 6 | 2022/10/19 | 2022/11/15 | 20 | ||
| 4.7 | TIMEBOX 7 | 2022/11/16 | 2022/12/13 | 20 | ||
| 4.8 | TIMEBOX 8 | 2023/01/14 | 2023/01/10 | 20 | ||
| 5 | PostProject | 2023/01/11 | 2023/01/19 | 7 | ||
| 5.1 | BenefitAssessme nt | Benefit Assessment | 2023/01/22 | 2023/01/30 | 7 | Business Visionary |
Assumptions
- The overall number of working days in a week is five, with Saturday and Sunday off.
- A single timebox is described above. The rest are identical, with only the start and end dates of each timebox provided.
- The final timebox indicates the overall evaluation of the project.
Deliverables:
Terms of Reference: The Terms of Reference describe the setting, goals, and purpose of a proposed project. This report describes the activities to be done as well as the difficulties, budget, and skills associated with the project.
Feasibility Assessment Document: It includes budget, cost, and time estimates, as well as the business and technical viability of the solution.
Outline Plan Document: It includes details on how the project should be handled and delivered.
Business Case Document: It illustrates why the project should start with business concerns and their answers.
Prioritized Requirement List: It outlines all of the project’s needs in terms of business concerns, which may be amended as the project moves forward.
Business Foundation: It describes the corporate participation necessary for the solution to be produced.
Solution Foundation: It contains how the product will progress with the development process, development standards, and review strategy.
Management Foundation: It describes the project management processes and how DSDM concepts aid in meeting the goal.
Delivery Plan: The outline plan covers the time management for delivering the solution.
Delivery Control Risk: It is a live document that includes the project status, risk log, and change management document.
Timebox Plan: It specifies which needs must be met within the timeframe and the timeframe’s objectives in relation to the delivery plan.
Evolving Solution: This is the solution that was developed in compliance with the specifications of the timebox plan.
Solution Assurance Plan: There are also business acceptance test cases and technical test unit records.
Deployment Plan: It defines the deployment plan for the solution when it has been fully created.
Deployed Solution: It is a complete solution that is employed in real-world business settings.
Timebox Review Report: It gives information on the timebox performance of people, projects, and technology.
Benefits Assessment: It considers how effectively the deployed solution aids in the resolution of the targeted business problem.
Chapter 5: Project Brief
Documentation Information
Project name: Book My Show an Online app for booking of movie tickets Platform Date: Date of the last approved version of this document
Author: Roshan Sah, Project Manager Owner: Richard Bedford
Document code: 1 Version: v1
5.1 Project Definition
5.1.1 Background
SoftTech Services Inc. is an international corporation with offices in the United States, Kenya, and Nepal. Finance, Human Resources Management, and Marketing are all administrative departments based in the United States. The firm plans to release a new product dubbed “Book My Show,” which will be a app-based booking and ticketing platform. This training platform has various elements that will give users with a good training experience, including online and offline usage options, as well as a feedback mechanism to constantly enhance the training. Users can sign up for the shows or pay for it. This enables students and teachers to communicate in a classroom setting, allowing them to gain more knowledge and offer questions and answer to others’ contributions.
5.1.2 Project Objectives
The main objectives of the project are given below:
Time: Project starts on May 6, 2021 and ends on Jan 30, 2023.
Cost: To complete the project within the budget of $ 675500.
Quality: To constantly test and analysis the product to develop a quality product.
Scope: To develop the product based on the functional and non-functional requirements provided in the project plan of the organization.
Risks: To deploy the product within the defined tolerance for the pre-defined risks. Benefits: To make sure that the product is valuable to the users around the world.
5.1.3 Desired Outcomes
The project’s goal is to give users with fulfilling training in both online and offline activities through enrollment in paid shows in various groups.
The following are the product’s desired outcomes:
- With this product, customers will be able to browse and see shows from a range of categories.
- Using this product, users will be able to download materials, videos and transcripts from a show.
- This product will be easy to use, with features such as current and finished shows, as well as the option to search for shows using a variety of parameters.
- Users will be able to browse or download content for offline viewing as well as watch videos inside the shows.
- This product will assist in sending emails to appropriate users in response to posts and submissions.
5.1.4 Project scope and exclusions
Project Scope:
SoftTech Services Inc., a worldwide corporation, created this project in order to expand their product range with the aid of their new product “Book My Show.” This project’s goal is to provide a training platform with a range of features that will give users with a good online and offline training experience, as well as a feedback mechanism to help them improve their training. Through this initiative, students may investigate and pick shows from a variety of areas. The following is a high-level explanation of the project’s scope:
Table 17: Components and Descriptions
| Components | Description |
| Create, choose and manage shows | Create, edit, view and choose the show contentfrom several categories. |
| Searching and downloading the content | Can search the content of the shows and can be downloaded and viewed offline. |
| Test and assignment | Can take test and submit assignment that are designed by trainers. |
| Feedback and recommendation | Can provide feedbacks and recommend shows toothers. |
Exclusions:
The above-mentioned deliverables will limit the scope of this project. The following components will not be discussed.
• No mobile applications will be available for the product.
• The video lessons in this program cannot be shared on social media.
• Other than English, no other languages will be supported.
5.1.5 Constraints and Assumptions
Constraints:
The project sets the limitations that the team must follow. The restrictions are linked to the project’s scope, cost, and timeline, all of which might have an influence on the project’s objectives.
- Scope: The project’s scope has previously been specified, and all team members should operate within the restrictions of the scope. Any changes will have an effect on the project’s strategy, timetable, and money.
- Cost: The total cost of the renovation is estimated to be $675,500. Any budget changes will have a direct influence on the project’s aim.
- Time: The project will start on December 6, 2021 and end on August 30, 2022. When calculating time, several factors such as resource availability, work rate, and working days are considered. As a result, any unexpected intrusion or incorrect forecast may jeopardize the project’s delivery schedule and aim.
Assumptions:
- A sufficient workstation is expected to be available for the project’s execution.
- It is anticipated that the DSDM technique will be used by everyone in the team.
- It is expected that the personnel working on this project are highly motivated.
- Teams are intended to have as few external dependencies as possible.
5.1.6 Project tolerances
Tolerance thresholds for money, time, scope, quality benefits, and risk have been determined in this project. It is not essential to notify upper management if a limitation falls below the tolerance level.
- Cost: Cost is fixed in the DSDM methodology.
- Time: Time is also fixed in DSDM methodology.
- Scope: A slight scope variation is tolerable.
- Quality: Variation in quality is not tolerable in DSDM.
- Risk: Tolerance of risk is low.
- Benefits: Benefits tolerance is set to a minimum.
If there is a change in the tolerance, it should be notified to senior management.
5.1.7 The user(s) and any other known interested parties
The project’s inception, development, and completion phases are all conveyed to all project stakeholders. The board members, Chief Executive Officer, Chief Technology Officer, Directors, Presidents, staff, and product clients are among those who have been notified.
5.1.8 Interfaces
After the completion of the project following components need to be updated:
- Websites, social media, and company pamphlets should be updated with new products.
- Training the sales team to educate the customers regarding the product with the demo.
- The marketing team should start a marketing campaign and toss announcement of the product
5.2 Outline business case
5.2.1 Reason
SoftTech Services Inc. is an international corporation with offices in the United States, Kenya, and Nepal. Finance, Human Resources Management, and Marketing are all administrative departments based in the United States. The firm plans to release a new product dubbed “Book My Show,” which will be a app-based booking and ticketing platform. This platform allows users to learn new things both online and offline. Because the firm intends to grow,
by introducing this product, which has several advantages, including the capacity to assist firms increase their market impact. This helps them maintain their market position, which increases the company’s value. The product will create a competitive advantage and will benefit the organization.
5.2.2 Expected Benefits
Following the completion of the product, the business anticipates the following benefits:
- The company’s market share will increase as a result of this product.
- This product will assist the firm in developing a solid portfolio.
- The product will be critical in improving the company’s value and growth.
- This product will help the company acquire new customers while also maintaining current ones.
5.2.3 Expected Dis-Benefits
The following are the project’s projected drawbacks:
- Because this product contains sophisticated information in the premium category, it may not be affordable to everyone.
- When more competent members are needed, the cost of remuneration rises.
- Because this initiative is web-based rather than mobile-based, it may result in a loss of market share.
- Because this system only accepts foreign payment methods such as PayPal, MasterCard, and so on, many local users are lost.
5.2.4 Time
The project is scheduled to begin on December 6, 2021, and conclude on August 30, 2022. The detailed time schedule is provided in the project time section.
5.2.5 Cost
Using a budget of $675,500 in mind, the team members will build this project with the necessary resources and supplies. A full budget computation is included in the appendix section.
5.2.6 Risk
The risk while doing the project are:
- Inaccessibility of adequately skilled resources.
- Employees take unplanned long-term leaves.
- Budget, scope, and time estimates are not exact.
- Lack of communication between team members.
5.3 Project product description
5.3.1 Title
The project is titled as “Book My Show” which is an app-based booking and ticketing platform.
5.3.2 Purpose
The purpose of the “Book My Show” initiative is to make internet ticketing for users, including performances, as simple as feasible. Students seeking engaging online and offline classes are the key consumers of current app booking.
5.3.3 Composition
- Online-based booking portal as well as online usage of downloaded material
- Paid shows
- Shows division in a category wise.
- Interactive classes
5.3.4 Derivation
As “Book My Show” is the new product line of the company so it is not derived from any other product.
5.3.5 Development skills required
The required skills for the completion of the project as listed below:
- Front-end development
- Back-end development
- Database development
5.3.6 Customer’s quality expectations
Because the team is dedicated about product quality, users will obtain a high-quality product. They will explain the tolerance levels and prioritize the client’s most important requests.
- Quality Criteria
- The product must solve the business problem.
- The finished product should meet the objectives indicated above.
- Quality Method
- Various tactics, such as Moscow Prioritization, are utilized to maintain and improve product quality.
- Prior to deployment, the product is carefully tested and assessed from both a technical and a business standpoint.
5.3.7 Acceptance criteria
The acceptance criteria for this project are given below:
- The product must be user-friendly
- The shows materials should be accessible online with the shows.
- The product must be highly secured.
- The system should send an email about the new or any updated shows to the new and relevant client.
- The system should be able to handle 100.000 users at once without slowing down.
5.3.8 Project-level quality tolerances
The quality should be effective and fulfill the stated standards for project acceptance.
5.3.9 Acceptance method
Signed document and email acceptance will be used to confirm acceptance.
5.3.10 Acceptance responsibilities
The Business Ambassador, Solution Testing Team, and Product Owner will be in charge of confirming approval.
5.4 Project approach
For this project, the Dynamic System Development Method was chosen as the technique (DSDM). The usage of DSDM, an agile development approach, will improve this project. Because of its concepts, methodologies, and outputs, DSDM is a suitable fit for this project. DSDM assists in meeting deployment timelines with a focus on business demands. The DSDM approach was chosen for this project because it enables better planning and communication among stakeholders in order to achieve the project’s needs.
5.5 Project management team structure
The Project Plan of this report includes a full picture of the project management team organization.
5.6 Role descriptions
The role descriptions are mentioned in the Project Plan section of this document.
descriptions are mentioned in the Project Plan section of this document.
Chapter 6: PRINCE 2 and DSDM
6.1 PRINCE 2
The PRINCE2 (Projects in Controlled Environments) technique is well-known and frequently used. It’s also a procedure-based project management strategy that will teach you the essential skills you’ll need to succeed as a project manager. PRINCE2 is versatile, and the most recent structural modification allows it to be more easily adjusted to any project you take on (Prince2, n.d.). It works well for both little and large tasks (Malsam, 2021). All project stages are clearly defined, roles and responsibilities are allocated to team members, and project control and management are straightforward and effective.
The integrated elements of the PRINCE2 method are (Malsam, 2021):
- Principles
- Themes
- Process
- Project Environment
Figure 12: PRINCE2 environment
Principles:
To become a PRINCE2 project, there are seven principles that must be followed. The principles are as follows (Malsam, 2021):
- Continued business validation.
- Learn from experience.
- Define responsibilities and role.
- Accomplish by stages.
- Accomplish by exception.
- Focus on the product.
- Tailor to the project situation.
Themes:
The project management discipline and why they are necessary are described by the themes of PRINCE2. They are:
- Business Case
- Organization
- Quality
- Plans
- Risk
- Change
- Progress Processes:
These determine what decisions must be made, who must make them, and when they must be made. There are seven processes in total:
- Starting up a project
- Directing a project
- Initiating a project
- Controlling a stage
- Managing product delivery
- Managing state boundaries
- Closing a project
In the diagram below, the utilization of PRINCE2 methods is demonstrated through the project lifecycle.

Figure 13: PRINCE2 project lifecycle
6.2 DSDM
The Dynamic System Development Method (DSDM) is an agile project management technique that includes a significant amount of current project management knowledge. DSDM considers the complete project life cycle. The second chapter of this study goes over all eight ideas, steps, and roles and duties.
6.3 Critical Comparison of PRINCE2 and DSDM
PRINCE2 and DSDM concentrate on product-based and business challenges. Because they are applicable to both small and big projects, both techniques may be used to manage information technology. The methods roles deliverables and responsibilities of the PRINCE2 and DSDM methodologies are comparable, as will be explained later.

Figure 14: PRINCE2 and DSDM comparison
The figure above depicts the common field between the two techniques, as well as how DSDM may be utilized in combination with PRINCE2. The section that follows provides a more detailed comparison of the approaches. Processes, deliverables, and roles will be discussed.
The following are differences between PRINCE2 and DSDM:
Table 18: Differences between PRINCE2 and DSDM
| Feature | DSDM | PRINCE2 |
| Method | Application developmentmethod | Project development method |
| Roles and Responsibilities | Business Sponsor, Business Visionary, Business Analyst, Technical Advisor, Technical Coordinator, Business Advisor, Business Ambassador, Team Leader, Solution Developer, Solution Tester, Workshop Facilitator, DSDM Coach | Executive, Project Board, Senior User, Project Assurance,Change Authority, Senior Supplier, Project manager, Team manager, Project Support |
| Life cycle | Pre-project Phase, Feasibility Phase, Foundation Phase, Evolutionary Phase, Deployment Phase | Starting up a project, Initiating a project, Directing a project, Controlling a stage, Managing product delivery, Managing state boundaries,Closing a project. |
| Requirement Dealing | Fixed budget and time | Fixed Budget, scope and plan |
6.3.1 Probing at Process Level
Any technique must go through many phases in order to provide an effective result. PRINCE2 has six processes with diverse activities. DSDM also continues to use a six-phase approach to project completion. The comparison between PRINCE2 and DSDM procedures is noted here.
Table 19: Probing at Process Level
| S.N | PRINCE2 Processes | DSDM Processes |
| 1 | Starting up a Project: It is the first PRINCE2 procedure and describes the project’s aim and expected outcome in commercial terms. It evaluates the establishment of the Project Board, the selection of an executive and a Project Manager, the design and selection of a project management team, the development of the Initiation Stage Plan, the compilation of the project brief, and the definition of the Business Case Outline. It also guarantees that risk, budget, time, and effort are all considered.. | Pre-Project: It formalizes and prioritizes a proposal in relation to the organization’s other activities and strategic goals. This process comprises selecting project responsibilities and scope, preparing for the feasibility phase, finding Business Visionaries and Business Sponsors, and writing the Terms of Reference. |
| 2 | Initiating a Project: To plan the specifics, a PID (Project Initiation Document) must be created. This phase comprises developing management strategies, approving an acceptable business case, setting up project control and project files, and developing a PID. | Feasibility and Foundation: The viability of the proposed project is identified in both business and technical areas by developing the Outline Plan. Foundations create the framework for a robust and long-term knowledge of the project, allowing for a more versatile project focus. During this phase, a document detailing the responsibilities, team structure, communication strategy, and project methodology is created. |
| 3 | Directing a Project: At this stage, the Project Board manages and monitors the project using reports and a management system depending on the number of decision points. This process’s primary actions include authorizing commencement, authorizing a project, establishing a stage plan, monitoring and controlling, and ensuring project conclusion. | Evolutionary Development: It takes an iterative, incremental approach to product development. It includes a timeframe for different priority needs, as well as effective risk management, team management, progress monitoring, and reporting to the Project Manager. The Delivery Control Pack paper is crucial in this procedure. |
| 4 | Controlling a Project: This protocol describes how to approve and receive the Work package. This stage entails evaluating work package authorisation, progress, project challenges, stage status, highlight, and finished work package information (Hughes, 2009). | Evolutionary Development: It takes an incremental approach, iterative to product development. It includes a timeframe for different priority needs, as well as effective risk management, team management, progress monitoring, and reporting to the Project Manager. The Delivery Control Pack paper is crucial in this procedure. |
| 5 | Managing Stage Boundaries: It describes what should be done if a stage’s tolerance thresholds are exceeded (Srivastava, 2021). The main phases in this process are to design a stage, authorize the next stage, complete the stage, report the stage end to the Project Board, and write an expectation plan. | Evolutionary Development: It takes an iterative, incremental approach to product development. It includes a timeframe for different priority needs, as well as effective risk management, team management, progress monitoring, and reporting to the Project Manager. The Delivery Control Pack paper is crucial in this procedure. |
| 6 | Managing Product Delivery: In this stage, the Project Manager accepts and executes a work package while also ensuring that it fulfills quality criteria. The job package is then given with approval of its completion. | Deployment: It focuses on operational utilization or being ready for delivery to the market or consumers. This stage involves the product’s final assembly, a final evaluation of what was supplied, and the product’s deployment into operational use. |
| 7 | Closing a Project: At this stage, the actions carried out as part of the project are explained. This stage’s activities include decommissioning a project, selecting next steps, reviewing the PID objectives, and updating the Issue Register. | Post-Project: It is completed following the last planned deployment and assesses the project’s success in terms of business value. So when lesson learned report as well as the benefits review process are completed, the project is complete. |
6.3.2 Probing in Roles
The duties and responsibilities allocated to each function in line with the project requirements help the project accomplish its purpose. Those tasks and duties are allocated in the project management team as part of the PRINCE2 and DSDM. The duties of various jobs are mapped out in the table below of PRINCE2 and DSDM techniques.
| S.N. | PRINCE2 Roles and Responsibilities | Possible Mapping with DSDM |
| 1 | Project Board: The Project Board is the highest level of management of a project. They are responsible for the success, direction, and leadership of the project, as well as competent decision-making for the company’s reputation. It involves the jobs of executive, senior user, and senior supplier (Office, 2009). | There is no mapping with DSDM Roles. |
| 2 | Executive: The executive serves as the head of the board and is in charge of making decisions, assuring project feasibility, and ensuring project worth. The executive creates and funds a business case. | Business Sponsor: The Business Sponsor is responsible for the project’s viability during development. A corporate sponsor creates a business case for a project and provides funding and resources. |
| 3 | Senior User(s): The Senior User is responsible for evaluating user needs and assessing the product while ensuring effective user communication. The Senior User determines the project’s value to the firm. | Business Visionary: The Business Visionary is responsible for developing product vision and expressing the relevance of project needs. This job is also responsible for managing stakeholder input, evaluating project progress, and determining project benefits. |
| 4 | Senior Supplier(s): The Senior Supplier represents the interests of the suppliers who are designing, facilitating, sourcing, and implementing the project with the quality of product generated by the suppliers on the project board. | There is no mapping with DSDM Roles. |
| 5 | Project Manager: The Project Manager is in charge of the day-to-day administration of the project, which includes planning, approving, monitoring, reporting, and taking necessary action. The Project Manager controls risk, time, money, quality, and benefit tolerances. | Project Manager: The Project Manager is responsible for both day-to-day management and high-level planning, scheduling, and project monitoring. The Project Manager reports to a Senior Business or Technical Role on risk management and team member problems. |
| 6 | Team Manager: The Team Manager is responsible for finishing the project on time and within budget. The Project Manager reports to the Team Manager, who controls the project’s needed personnel. | Team Leader: The Team Leader encourages team members to focus on the product’s schedule and budget by organizing reviews, retrospective daily meetings, and reporting progress to the Project Manager. |
| 7 | Project Assurance: Project Assurance is responsible for monitoring project performance, the interests of important stakeholders, business, suppliers, and users, and alerting the Project Manager. | Business Ambassador: The Business Ambassador works with the Solution Development Team to ensure that the product fits the company’s needs.. |
| 8 | Change Authority: A designated individual or group, or the Senior User, is in charge of managing project modification requests. | Business Visionary: The Business Visionary’s responsibilities include coordinating stakeholder input, tracking progress, and recognizing project benefits. |
| 9 | Project Support: The Project Manager has the option of taking on the empowering position of Project Support for the project. | Agile Coach, Advisors, and Workshop Facilitator: These positions assist the project in its varied tasks. |
6.3.3 Probing at Deliverables
Both PRINCE2 and DSDM provide a range of results in every process and activity in a project. The deliverables of PRINCE2 and DSDM are contrasted in the table below.
Table 21: Probing at Deliverables
| S.N. | PRINCE2 Deliverables | Possible Mapping with DSDM |
| 1 | Benefits Review Plan: It entails determining how and when the product’s advantages will be assessed. | Benefits Realization Plan: It is produced at the deployment stage, when benefit evaluation is intended. |
| 2 | Business Case: It describes how long the project will take, how much it will cost, how hazardous and beneficial it will be. | Business Case: It includes a vision and explanation for the project’s launch, as well as information on the business challenges and remedies. |
| 3 | Checkpoint Report: A team member hands it to the project manager and describes how the project is proceeding. | Timebox Review Record: It is presented to the Project Manager by a Team Member and summarizes the project’s status and timeline. |
| 4 | Communication Management Strategy: It describes how the project and its stakeholders will communicate. | Management Approach Definition: It justifies the project’s management and stakeholder procedures. |
| 5 | Configuration Item Record: It describes how to govern a configuration object such as a product, its components, and product release. | There is no mapping with DSDM Roles. |
| 6 | Configuration Management Strategy: It describes who and how the configuration items record will be handled. | Management Approach Definition: It justifies the project’s management and stakeholder procedures. |
| 7 | Daily Logs: It keeps track of the everyday challenges and problems that the project manager must handle. | Timebox Review Record: It is presented to the Project Manager by a Team Member and summarizes the project’s status and timeline. |
| 8 | End-Stage Report: This document will include information about the last stage. | Project Review Record: It gradually integrates deployment data. The project evaluation, as well as records of lessons learned, are also included in the final increment. |
| 9 | End Project Report: This document is delivered to the project board once the product has been deployed and evaluated using PID. | Project Review Record: It eventually integrates deployment information. The project evaluation is also included in the final increment, as are records of lessons learned. |
| 10 | Exception Report: It maintains a plan in place in the event of an emergency. | There is no mapping with DSDM Roles. |
| 11 | Highlight Report: It is delivered to the project’s board of directors to describe the progress and status of the stage. | Timebox Review Record: It is presented to the Project Manager by a Team Member and contains information on the project’s status and review according to the timeframe. |
| 12 | Issue Register: It has an issue log that is properly handled. | Delivery Control Pack: It includes risk logs, Change Control Records, and timely reports to sponsors. |
| 13 | Issue Report: All formally handled issues have impact and mitigation records. | Delivery Control Pack: It includes risk logs, Change Control Records, and timely reports to sponsors. |
| 14 | Lesson Log: It records all of the lessons learned from current and prior initiatives. | Project Review Record: It gradually integrates deployment data. The project evaluation, as well as records of lessons learned, are also included in the final increment. |
| 15 | Lesson Report: It records the lessons learned in order to utilize them in future initiatives. | Project Review Record: It gradually integrates deployment data. The project evaluation, as well as records of lessons learned, are also included in the final increment. |
| 16 | Project Plan: Describes what, when, how, and who information is needed to meet the project’s objectives. | Outline Plan Document: It describes how to manage a project and produce a product. |
| 17 | Product Description: It outlines a product’s purpose, composition, origin, and quality requirements. | Solution Architecture Definition: It takes into account the influence of product delivery on both commercial and technical difficulties. |
| 18 | Product Status Account: It describes the current condition of products within the constraints given. | Solution Architecture Definition: It takes into account the influence of product delivery on both commercial and technical difficulties. |
| 19 | Project Brief: It defines the project’s aim, budget, timeframe, quality, tolerance, and constraints. | Business Case: It includes a vision and explanation for the project’s launch, as well as information on the business challenges and remedies. |
| 20 | Project Initiation Document: It evaluates information of the project’s inception, administration, and control. | Solution Foundation: It contains the information needed to start, administer, and control the project, as well as papers BAD, SAD, and DAD. |
| 21 | Project Product Description: It defines the project’s scope, as well as the customer’s quality expectations and acceptance criteria. | Solution Architecture Definition: It takes into account the influence of product delivery on both commercial and technical difficulties. |
| 22 | Quality Management Strategy: To develop a high-quality product, techniques and criteria are established and must be followed. | Solution Development Standards: It specifies the criteria and processes that must be followed in order to generate a high-quality product. |
| 23 | Quality Register: It includes a record of all actions that have been planned and completed. | Project Review Record: It gradually integrates deployment data. The project evaluation, as well as records of lessons learned, are also included in the final increment. |
| 24 | Risk Management Strategy: It defines the risk management strategies, roles, tools, and processes that will be employed throughout the project. | Risk Assessment Document: It includes a risk mitigation strategy for the identified risk during the feasibility stage. |
| 25 | Risk Register: It maintains track of known threats, their details, and their history. | Risk Log: It is indicated in the delivery control pack, which records all hazards. |
| 26 | WorkPackage: It comprises all of the information concerning the development of a product. | Timebox Plan: It is used to organize jobs that must be done within a certain amount of time. |
| 26 | WorkPackage: It comprises all of the information concerning the development of a product. | Timebox Plan: It is used to organize jobs that must be done within a certain amount of time. |
References
AcqNotes, n.d. AcqNotes. [Online] Available at: https://acqnotes.com/acqnote/careerfields/software-development-approaches [Accessed 03 12 2021].
ALLIANCE, S., n.d. SCRUM ALLIANCE. [Online]
Available at: https://resources.scrumalliance.org/Article/scrum-artifacts [Accessed 05 12 2021].
Business, A., n.d. Agile Business. [Online] Available at: https://www.agilebusiness.org/page/ProjectFramework_06_Process [Accessed 18 12 2021].
Chisel, n.d. Chiesel Blog. [Online] Available at: https://chisellabs.com/blog/moscow-method-prioritization-overview/ [Accessed 22 12 2021].
Hughes, B., 2009. Software Project Management 5e. s.l.:s.n.
Kashyap, S., n.d. proofhub. [Online] Available at: https://www.proofhub.com/articles/traditional-vs-agile-project-management [Accessed 20 12 2021].
Malsam, W., 2021. Project Management. [Online] Available at: https://www.projectmanager.com/blog/prince2-methodology[Accessed 16 12 2021].
Mavuru, I., 2018. kpipatners. [Online] Available at: https://www.kpipartners.com/blog/traditional-vs-agile-software-development- methodologies
[Accessed 04 12 2021].
Office, T. S., 2009. Directing successful projects with PRINCE2. s.l.:s.n.
Pankaj, 2019. geeksforgeeks. [Online] Available at: https://www.geeksforgeeks.org/difference-between-traditional-and-agile- software-development/
[Accessed 03 12 2021].
Paradigm, V., n.d. Visual Paradigm. [Online] Available at: https://www.visual–paradigm.com/scrum/what-are-scrum-ceremonies/ [Accessed 05 12 2021].
Plan, P., n.d. Product Plan. [Online] Available at: https://www.productplan.com/glossary/moscow-prioritization/[Accessed 15 12 2021].
Prince2, n.d. Prince2. [Online] Available at: https://www.prince2.com/uk/what-is-prince2 [Accessed 22 122021].
RENDER, J., 2018. Agile Mercurial. [Online] Available at:https://agile-mercurial.com/2018/07/09/a-full-lifecycle-agile-approach-dynamic- systems-development-methodology-dsdm/
[Accessed 10 12 2021].
RENDER, J., 2019. Agile Mercurial. [Online] Available at: https://agile-mercurial.com/2019/04/03/dsdm-project-management-roles-and- responsibilities/
[Accessed 20 12 2021].
Sachdev, 2016. Scrum Methodology. International Journal Of Engineering And Computer Science, pp. 16792-16800.
SANTOS, J. M. D., 2021. Project Management. [Online] Available at: https://project-management.com/understanding-responsibility-assignment- matrix-raci-matrix/
[Accessed 15 12 2021].
Srivastava, B., 2021. Simplelearn. [Online] Available at: https://www.simplilearn.com/prince2-processes-article [Accessed 22 12 2021].
Stapleton, J., n.d. DSDM, Dynamic Systems Development Method: The Method in Practice.
s.l.:Cambridge University Press.
APPENDIX:
Budget Calculation:
Table 21: Budget Calculation
| Work Packages | Duration | Resources | Man Day/Cost | Materials | Cost |
| Pre-Project Activities | 3 | 2 | 350 | 2100 | |
| Feasibility Phase Activities | 5 | 4 | 400 | 8000 | |
| Foundation Phase Activities | 10 | 6 | 400 | 24000 | |
| Timebox 1 | 20 | 13 | 300 | 6000 | 84000 |
| Timebox 2 | 20 | 13 | 300 | 78000 | |
| Timebox 3 | 20 | 13 | 300 | 78000 | |
| Timebox 4 | 20 | 13 | 300 | 78000 | |
| Timebox 5 | 20 | 13 | 300 | 78000 | |
| Timebox 6 | 20 | 13 | 300 | 78000 | |
| Timebox 7 | 20 | 13 | 300 | 78000 | |
| Timebox 8 | 20 | 13 | 300 | 6500 | 84500 |
| Post Project Activities | 7 | 2 | 350 | 4900 | |
| Total Estimated Budget | 675500 | ||||
Assumptions:
- A total of 12 members of the Development Team and Team Leader will take part inthetimeboxes.
- The development of new Server and Security Factors for the product cost $6000 in the timebox 1.
- Disaster Recovery and Load Balancing cost $6500 in the timebox 8.

Cyber Security Management – HTTP COOKIE WEAKNESS, ATTACK METHODS AND DEFENCE MECHANISMS
Abstract
On the internet, HTTP cookies are a commonly utilised approach. Numerous significant data breaches have shown that a range of attack techniques can interfere with cookies. It was inevitable to find out about cookies’ shortcomings. ICT experts have identified a number of cookies’ flaws and vulnerabilities. The draught upon which the cookie protocol is based was signed almost twenty years ago. Through a thorough assessment of the literature, this study identified cookie vulnerabilities, attack strategies that take advantage of them, and defence strategies to lessen the impact of the attacks. A review and rating of the literature on cookie specifications, attack techniques, and defence techniques was conducted.
Based on existing research, cookies and sending protocols contain flaws and vulnerabilities that hackers can take use of. The study highlighted cookies’ lack of integrity and secrecy. To increase the success percentage, the cookie protocol should be modified. In their current state, cookies are susceptible to TCP/IP hijacking, session fixation, cross-site scripting, cross-site request forgery, poisoning, hijacking, and manipulation. There should be a range of defence strategies employed to lessen the attacks.
Keywords: cross-site request forgery, HTTP cookie, cross-site scripting, vulnerability, session fixation, TCP/IP hijacking
Table of Contents
4.2 Attack Types and Defense Methods
4.3 HTTP Cookie Confidentiality
1 Introduction
The majority of Internet services have ads. Advertisements fund services. According to PwC Advisory Services, US advertising revenues were $59,6 billion in 2015. Year after year, advertising revenue climbs rapidly. Paid ads are “online advertising.” Advertisements enable free website and app access. Interest-based advertising targets users’ preferences. Businesses can push items and services to users based on their needs. Advertisers must profile and track users to customise ads. (2017, Hassan & Hijazi, p. 9.)
Most Internet providers advertise. Ads fund some services. For instance, PwC Advisory Services estimates 2015 US advertising revenues at $59,6 billion. Advertising revenue rises rapidly annually. Such advertising is called “online advertising.” Web apps and websites are free thanks to adverts. Interest-based advertising targets users’ preferences. This lets companies market directly to consumers based on their needs. Advertisers must track and profile users to personalise adverts. Hassan & Hijazi (2017)
Could HTTP cookies be used to launch cyberattacks or gather opponent information? Cookies: do they reveal defence secrets? The protection mechanism just needs one reckless user. The target website may send the cyber attacker a cookie with a unique identification code to identify them (Green, 2015). Green claims that the attacker must accept cookies and only use web protocols.
Cookies can be attacked in several ways. To secure cookies, several security procedures must be changed. In 2017, Yahoo discovered that hackers accessed 32 million user accounts without passwords via cookie forgeries (CNet, 2017). Cookies are subtle but effective. They must be well-defended. Several studies say cookies aren’t secure enough. Many online agents use cookies to understand their consumers’ needs.
1.1 Current Scenario
The Internet uses stateful and stateless protocols. A stateful protocol changes connections, processes, and processes. Disconnect and delete state data. Staatenless protocols neglect completed transactions. Nothing to remove. Bangia (2005) Stateless HTTP sends cookies. States in cookies. Two browser requests can be differentiated using cookies. Mozilla (2018)
Computers store website cookies. Text-based cookies identify people. The website tracks unique visitors. Website cookies store user preferences and behaviour. Cookies enable websites to serve relevant content when you return. Sessions are customised by F-Secure cookies. Carts and logins are cookie-stored. Cookies store user and other preferences to customise webpages. Cookies track and analyse user behaviour. Cookie-tracks Mozilla (2018). Websites can share tracking cookies. Cookies personalise content based on browsing. Cookies from F-Secure track webpage input. Data is stored on servers. Tracking cookies monitor internet use. Activity is affected by IP. Databases view logs remotely. Browser cookies update as pages or adverts load. (2013) Tom’s Guide
Website advertising is tracked by third-party cookies. The function provides accurate content. Third-party ads store cookies. Visit another site with red cookies and the same ad service. Other page banners. The service tracks both websites’ visitors. Many antivirus and antispyware products disable tracking cookies. (F-Secure).
Companies must modify marketing to boost internet sales. Traditional marketing doesn’t reach modern consumers. Most consumer marketers win. Customer-focused marketing must address tastes. The cookies store preferences. Privacy advocates detest tracking cookies. Internet users have had little privacy since their first search.
Internet actors gather user data in numerous ways. Web analytics gathers user data (Clifton, 2012). Analytics can show companies how many visitors arrived and what they did (Clifton, 2012). Web analytics tools include Google Analytics.
This paper discusses cookie specifications, weaknesses, flaw-exploiting attacks, and defences. Study suggests RFC 6265 cookie requirements. Several studies address specification errors. We examined attack tactic studies. Several studies reveal attack strategy resistance. Cookie specifications are problematic, attack methods exploit them, and defences limit them. No study estimated event scope utilising cookie definition, attack techniques, and defences. Learn the event’s numerous causes with data. Insufficient evidence supports spectrum exploration. Because prior studies concentrated on details, this one is smaller. The study will assess cookie vulnerabilities, attacks, and defences. Study explores cookie popularity determinants.
1.2 Objectives
This study aims to analyse the nature of cookies to fully understand their vulnerabilities and the specific weaknesses they possess. Understanding the functionality of cookies and the impact of their properties on security provides insight into their vulnerabilities. Understanding the cookie mechanism that impacts most individuals globally is essential. To devise new mechanisms or reinforce existing methods for cookie protection, it is important to first comprehend the vulnerabilities of cookies and identify the specific components that are susceptible.
The objective of this study is to generate findings that expose vulnerabilities in cookies, types of attacks, and mitigation strategies. Consequently, providing a comprehensive elucidation of cookie security. This study aims to address the research topics by conducting a comprehensive literature review of cookie specifications, attack methodologies that exploit vulnerabilities in these specifications, and protective measures for safeguarding cookies. The research will disclose deficiencies in cookies, methods of attack, and security mechanisms.
1.3 Problem Definition
The Thai systematic literature review will examine the question: “What are the vulnerabilities of HTTP cookies?” Secondary research questions encompass: “What types of attacks exploit vulnerabilities in HTTP cookies?” Additionally, “What defensive strategies can be employed to mitigate the assaults?” No prior studies of this magnitude have integrated cookie specifications with attack methodologies that leverage cookie vulnerabilities and defensive tactics that safeguard cookies. Numerous studies have been undertaken to examine the deficiencies and susceptibilities of cookies, along with a particular attack strategy to exploit these vulnerabilities.
The primary focus of the study is selected to provide valuable insights on the cookie features that require assessment. The initial secondary research question provides insight into the impact of cookie vulnerabilities on cookie security within the primary study issue. The final research question examines strategies to enhance cookie security.
The paper examines cookies by analysing their vulnerabilities, the attack methods that exploit these weaknesses, and the defensive measures that mitigate such attacks. The cookie strengths have been eliminated and are excluded from this investigation. This study does not examine the rationale for the utilisation or non-utilization of cookies. Cookies are the predominant method for identifying online users and sessions. Consequently, it is unnecessary to indicate whether cookies ought to be utilised or not.
2. Literature review
The research that has been done on the topic is analysed in this chapter. There are a few different perspectives regarding the topic. To begin, it is necessary to investigate the concept of digital privacy in relation to the surveillance of internet users, which is performed through the utilisation of cookies. The European Union has passed legislation that places restrictions on the preservation of information pertaining to users. After that, we will have a discussion of the fundamentals of HTTP cookies. There is no better way to monitor people than through the usage of HTTP cookies. There is a wide variety of cookies to choose from.
The literature that defines cookie specifications, the literature that explores attack methods that effect cookies, and the literature that examines defence mechanisms to minimise attacks are the primary areas of focus for this study. Aspects of cookie privacy, cookie specifications, cookie kinds, cookie vulnerabilities, cookie attack methods, and defence mechanisms to minimise attacks are the components that make up the framework of the review.
2.1 Digital Privacy
What we mean by “digital privacy” is the protection of personal information online. Information is generated through the use of public networks for either personal or business conversations. The identification of information sources is an essential part of digital privacy. In the time since Edward Snowden disclosed the materials of mass surveillance programs, there has been a conflict between legitimate spying and privacy. During a Google search, the user’s phrases, the date and time of the search, and their IP address are all recorded. The usage of the internet and surfing habits are monitored in order to generate individualised profiles. 2017 edition; Hasan, Hijazi.
Both forms of data are produced by actions taken online. One type of information is known as personally identifiable information (PII), which is often referred to as sensitive personal information. Second, there is the category of anonymous data. Names, biometrics, Social Security numbers, gender, and passport numbers are all examples of personal information. According to Hassan and Hijazi (2017), user information such as browser type, version, location, school, nation, and linked device type are all anonymous.
A directive to save data was issued to member states by the European Parliament and Council in the year 2009. In accordance with the law, Member States are required to provide subscribers and users with information that is both clear and comprehensive regarding the processing of personal data. When it comes to storing or accessing information in her terminal equipment, the subscriber or user is required to give their consent. The type of data storage or the technique of data storage is not restricted by the regulation.
Using cookies, web servers are able to follow users. Cookies have recently come under fire. Web analytics allows businesses to monitor how users navigate their websites. During the entirety of user agent sessions, cookies remain in existence and can be transferred between other domain hosts. It is possible for hosts that belong to the same domain to share resources if a user agent deems a missing Domain property to be present and it contains the current host name. As of 2011, Barth
2.2 HTTP Protocol
HTTP is an application protocol. Hypermedia, distributed, and collaborative systems use HTTP. The Internet transfers data via HTTP. http uses TCP/IP. Tutorial Links TCP/IP mixes IP and TCP. Network protocols differ. Rules and procedures are protocols. Protocols enable computer data sharing. TCP/IP connects browsers and servers. 2018 (Lifewire).
Internet communications and files are sent over TCP. Once delivered, packets are reassembled. The IP ensures data packet delivery. TCP/IP has datalink, networking, transport, and application layers. Known as application layer. Link protocols are controlled by datalink. Networks link hosts. The networking layer allows data packets to cross network boundaries.
Host communication is transported. Multiplexing, flow control, and dependability plague the transport layer. Data is standardised by app layer. Lifewire (2018) defines HTTP as client data creation and transfer. The HTTP specification addresses server answers to client requests. Three components make HTTP. Browsers send HTTP queries to servers. The client leaves the server after the request. Clients expect server responses.
The server will respond to the client after reconnecting and processing the request. HTTP is connectionless after requests. Because of this, HTTP can transfer anything. Both client and server must manage data. HTTP’s media neutrality is confirmed. HTTP lacks connections, making it stateless. Both server and client know requests. HTTP is request-and-response. HTTP is client-server. Clients request TCP/IP from servers. Method, URI, and protocol requests. Messages can comprise body content, request modifiers, and client info. Requests reach servers.
Results include success or error codes, server info, entity Meta data, and sometimes entity-body content. Protocol messages are returned. Instructional Point
HTTP uses URIs, or “Uniform Resource Identifier,” to identify resources and start connections. Send HTTP messages after connecting. Server responses and client requests are messages. A name, location, or other information is in the URI string.
3 Critical Analysis
Cookie weaknesses are found by reviewing cookie vulnerability, attack path, and protection literature. Research utilised systematic literature review. From prior knowledge, a literature review explains the phenomenon. This study analyses and synthesises research. This initiative will solve research problems using proof.
Clear and specific research questions are addressed in systematic literature reviews. A systematic literature review reduces bias and replicates. A comprehensive literature review uses several studies. We discuss the findings’ relevance and practice implications. A systematic literature review finds all relevant research, analyses its quality, and scientifically summaries its conclusions after choosing a topic (O’Brien and Guckin, 2016).
Research benefits from systematic literature reviews. Systematic literature reviews employ extraction search methods to examine all relevant research. Methodologically reviewing and summarising studies. We found, evaluated, and compiled all relevant research. A methodical literature review addresses research questions. Transparency and rigorous criteria prevent bias in systematic literature reviews. Systematic literature reviews show the phenomenon’s adaptability. An extensive literature review may reveal research gaps and areas for further study (O’Brien and Guckin, 2016).
Systematic literature reviews’ pros and cons. Systematic literature reviews moderate bias but not distortion. Critical review data extraction inclusion and exclusion criteria might misrepresent data if misused. No standard approach evaluates study validity. Reviewers may disagree on data gathering and analysis. (2016) Guckin O’Brien
Consider various factors while assessing a systematic literature review. Find relevant research first.
Next, assess the study’ methodology. Determine and decrease distortion. (2016) Guckin O’Brien
3.1 Background
A study subject starts a comprehensive literature review. The researcher’s interests dictated the study’s main focus. Reviewing books and websites revealed cookie research gaps. Found a gap. Researchers’ interests and gaps shaped this study’s objective. Duplicate research was avoided by adding two questions. The investigation sought cookie vulnerabilities, attacks, and countermeasures.
Many databases were searched after the study questions were created. Finding relevant literature with these keywords:
• HTTP cookies (7214)
• HTTP cookie requirements (2244)
• (896 results) HTTP cookie vulnerability
• HTTP cookie bug (332 results)
• HTTP cookie exploitation search results: 1259
• 1991 search results: secure HTTP cookies
• HTTP cookie protection search results: 239
We mentioned keywords above. Created cookie-specific keywords. The search results would be worthless without “HTTP” keywords. The search followed Figure 1.
Figure 1: Searches strategy
Six actions were taken to search. Study question and purpose were established. After selecting databases, search queries were created. Searches targeted specific databases. Google Books, Scholar, and JYKDOC were used.
Google was used to supplement literature evidence.
The preliminary search sought relevant materials. There were 14,175 papers found. Article titles were screened for irrelevant content. Papers were reduced to 232. The abstracts and keywords were examined to find relevant works. Paper count dropped to 112. Complete papers were reviewed to conclude the search approach. After reading, 94 important papers were selected.
After that, inclusion and exclusion criteria were set. This study’s scope and aims sought to answer the research question precisely. The study examines literature-identified shortcomings, attack techniques, and defence mechanisms. Select and critically examine relevant studies to determine quality. This thesis answers “What are the vulnerabilities of HTTP cookies?” using inclusion and exclusion criteria.
Table 4 lists inclusion and exclusion criteria.
| Criteria | Inclusion criteria | Exclusion criteria |
| Criteria 1 | Address cookies’ technical mechanisms | No technical aspects |
| Criteria 2 | Must discuss cookies in comprehensive environment | Does not address the comprehensive environment of cookies |
| Criteria 3 | Must indicate weaknesses of cookies | Lacks current, relevant information |
| Criteria 4 | Examines the factors that affect cookie function. | Lacks discussion of cookie-affecting factors |
Certain criteria were used to choose literature. The title and abstract were used to research cookies, cookie properties, weaknesses, attack methods, and defences. Adequate results affected precision. The literature evaluation included 31 books, 6 research publications, and 22 internet references after matching search results to inclusion/exclusion criteria.
The research relied on RFC 6265 (Barth, 2011), OWASP, and CVE cyber security vulnerability and exposure dictionary. The research benefited from Dubrawsky (2007, 2009, and 2010), Rustic (2014), and the EC-Council (2010, 2017). The linked documents and RFC 6265 specification were examined in this study, supporting and challenging its specification.
Cookies were defined and faults found in RFC 6265. The specification included more information to help understand cookies, the cookie protocol, their mechanics, and more.
Search results were manually classified and documented.
The categories were: Specification – Weakness or vulnerability Technique of attack Defence mechanism
Meta-analysis compared comparable queries. The similarities were examined to diversify cookies. To avoid repetitions, searches were recorded.
Next, study quality was appraised. Quality was assessed by monitoring research design, execution, and reporting. If the literature design, conduct, and reporting were solid, the study continued. There were studies that answered the research question. Study inclusion was met. Removed irrelevant studies.
The literature review concluded with search results. We published understandable search results. Results were tabulated for analysis. Review and discuss outcomes.
3.2 Issue Identification
This analysis largely relies on documents detailing cookie technical specs, attack tactics, and defence strategies. To verify the documents’ results, researchers review the evidence online. Modifying or adding components to tests can change results.
Repeating the study with the same methods and literature should generate similar results. An inquiry with technical testing may generate various results. When findings differed, requirements were changed. Cookie operation is well-defined. Changes in attack plans and tactics may provide different results. However, cookie requirements and functions work well in practice. Thus, cookies and attacks must be altered to produce different effects.
This study answered research questions. This study investigated cookie vulnerabilities, attack techniques, and defences. Cookies’ vulnerabilities and weaknesses were thoroughly explained by the research. Attack techniques that exploit cookie vulnerabilities were also found. The study also suggested environmental cookie protection techniques.
4 Summary
Cookies are flawed. Information security is difficult because attack methods change quickly while defence systems don’t. Cookies are essential to web service user experiences. The use of cookies is challenging. As a strategy, cookies are vulnerable and biassed as an incomplete component with promise, but severe attack methods might cause serious arbitrary implications. This section discusses study findings. First, cookie weakness results are provided. Results on attack and defence techniques follow.
4.1 Weaknesses of HTTP Cookie
Cookies can make developers use ambient authority. Remote parties could distribute user agent HTTP requests utilising ambient authority. Any web server that uses cookies for authentication allows this. Security risks arise from user authentication cookies. Attacker could use CSRF. This issue may complicate the debut.
Cookies encourage web servers to separate designation and permission. Thus, an attacker can specify user agent-authorized resources. A web server or its clients may accomplish an attacker’s tasks. Evil will be punished.
All data inputs are dangerous. Internet services should verify user input. Never trust user reviews. Web service inputs are fragile.
Problematic cookies contain session identifiers. Attackers can transfer session identifiers from cookies to the victim’s user agent. Thus, the victim can communicate with a web server using session identification. The transplanted session identification contains the victim’s login or sensitive data. The unset secure property in cookies lets an attacker intercept outbound user agent requests and hijack searches even with HTTPS. If the cookie has the session ID, this may happen. By intercepting HTTP requests, the attacker can redirect them to a web server. User agent cookies are included in HTTP requests even if the web server does not listen.
HTTPS protects cookies better than HTTP. Cookies are sent in clear text across insecure networks. Cookie and Set-Cookie headers may contain sensitive data that can be overheard.
Malicious intermediaries may discard headers during insecure transfer. A rogue client could alter the Cookie header before delivery.
Missing Domain characteristics may be misconstrued as the host name by user agents. Other domain hosts can receive cookies. Because user agents can only hold so much data, they may delete cookies. Hackers can store several cookies on the victim’s agent. User agents must delete cookies after the storage limit.
4.2 Attack Types and Defense Methods
We must emphasise that no defence plan can guarantee perfect security against developing attack techniques. Design cookie-attack defences on the idea that they will be compromised. Developers should evaluate how attackers could attack or compromise the function being created. No foolproof measures exist.
Attackers should have more difficulty.
Table 5 lists cookie problems, attack techniques, and defences.
| Weakness | Attack method | Definition | Defense mechanism |
| Identification cookies (ambient authority cookies) | CSRF, cookie poisoning | Request origin cannot be reliably authenticated. | Separately check source and target origins. Same Site attribute should be set to strict mode. Web application firewall should be used. |
| Separating designation (URLs) from authorization (cookies) | CSRF | A resource designated by an attacker might be supplied authorization by a legitimate user. | Authorisation should not use cookies. URLs could be capabilities. Same Site attribute should be stringent. |
| Untrusted data inputs | XSS | Script designed to extract cookie data can be injected into a web site by an attacker. | Avoid untrusted data inputs. Set the HttpOnly flag |
| No integrity for sibling domains and their subdomain | Cookie injection from related hostnames | Sibling domains (like foo.website.com) can set cookies with another domain’s Domain attribute value (like website.com) and override cookies set by other domains (like bar.website.com). |
4.3 HTTP Cookie Confidentiality
Information is protected from harmful operators while permitted operators can access it. Allow only authorised users to access sensitive data. Usually, encryption ensures confidentiality.
The report shows cookie secrecy is low. Results fix server-side isolation flaws shown by port, scheme, and path. Cookies are exposed when server services on different ports are not segregated. Multiple services on a server can read the same cookie. Different server services on different ports may write cookies that one service may. Many host ports should not run untrusted services. No security-sensitive data should be saved in cookies by hosts.
Lack of scheme isolation affects cookie secrecy. HTTP and HTTPS use cookies. Cookies can be accessed over FTP without isolation. Cookies lack scheme separation, thus processing demands reflect this.
Cookies don’t isolate pathways, research shows. Non-HTTP APIs let user agents access path-specific cookies. A few user agents separate resources from distinct pathways. Resources from other paths can access cookies from one.
4.4 HTTP Cookie Integrity
Data integrity means consistency, accuracy, and confidence. Non-authorized operators should not convert data during transmission.
HTTP and HTTPS cookies do not guarantee server-side integrity for sibling domains and subdomains. Cookies from foo.website.com may have a different Domain attribute value than the sister domain. Overwrite the web server’s subdomain’s Domain attribute. This user agent sends subdomain cookies and HTTP requests. Subdomains may not distinguish cookies from self-set cookies. A subdomain can target other host domains.
Cookie Path is unreliable. User agents accept Set-Cookie header Path attributes. Attackers can inject cookies into Cookie headers. An attacker can imitate web server responses. HTTPS servers can’t distinguish attacker-injected cookies from HTTPS response cookies. Thus, even if the web server only sees HTTPS, an attacker can steal cookies.
A malicious user can inject cookies into https://website.com/’s Cookie header, mimic replies, and inject Set-Cookie. The HTTPS answer from website.com cannot distinguish between attacker-injected and server-set cookies. Although the server uses HTTPS, the attacker can still attack. Encrypting and signing cookies may lessen these risks. But the attacker can replay a cookie from the real website.com server in the user’s session. Thus, cryptography cannot stop all attacks.
RFC 6265 lacks confidentiality and integrity techniques. The domain setting the cookie is not always authorised by browsers.
5. Discussion
What are HTTP cookies’ weaknesses? was our master’s thesis. Secondary research included “What attacks use HTTP cookie flaws?” . “What defence mechanisms can reduce attacks?”
A lot of cookies are bad. Developers may utilise cookies for ambient authentication. The system is vulnerable to CSRF since cookies are “ambient authority” for authentication. Sessions may be fixed using session-identifier cookies. Cookies should not save session IDs, according to most studies.
Cookies don’t authenticate. Attackers can access websites via cookies. Cookies don’t protect session IDs. Attackers target session ID cookies, according to many sources. Hackers with session identifiers might wreak major damage. Many large-scale cookie assaults may destroy users and web servers.
Cookies should not verify users. URLs are designated and permitted. Secrets would replace cookies in URLs. App security improves. A remote entity must reveal the secret.
Developers must set the secure flag in cookies and send them via HTTPS to use the secure attribute. When sending cookies across encrypted networks, set the secure flag. Attackers can see active queries with insecure cookies. The Secure property does not safeguard cookies. Cookie privacy is protected by secure. Cookie secrecy but not integrity are protected by HttpOnly. It’s intriguing that cookies degrade. Nothing separates cookies by port, scheme, or path on the server. Without quarantine, siblings and subdomains are intact. Path lacks integrity. Cookies lack privacy. Cookies mostly follow a 1994 draft, thus this is possible. Examine the cookie model and processes to find all threats.
Attacks sometimes exploit cookie flaws. A poisoned cookie allows an attacker access sensitive website or user data. With cookie manipulation, an attacker can generate, overwrite, or put arbitrary cookies. A cookie-stealing script can be injected into a website. CSRF allows attackers to steal identities and hurt victims. Attackers can access victims’ sessions using TCP/IP hijacking.
This study is disastrous because cookies track users, save session IDs, and keep login passwords. Trust in cookies is at jeopardy. More study on cookie functioning and vulnerabilities is needed to address the concerns broadly and protect cookies.
This study found important scientific findings. Insufficient research has been done on cookies to develop comprehensive answers. Cookies should be studied by science and software engineers to improve solutions. This study can identify and exploit flaws.
There are no cookie threat defensive solution models in the literature. Due to their global impact, cookie protection must be studied. No new cookie defensive strategies are addressed in this study. Literature and standards inform defence. Assessing cookie risks and weaknesses requires more research.
Most conclusions are trustworthy. RFC 6265 was investigated. This paper confirms the study’s conclusions. Many studies use the cookie data.
More research is needed after the study. Study cookies’ lack of port, scheme, or path segregation to uncover explanations. Cookie science research also focusses on improving cookie security by strengthening and updating attributes.
6. Conclusion
Cookies are common in online services. This study examined cookies to find weaknesses. Weaknesses prompt exploitative conduct. Defences should protect cookie operation. Cookies have vulnerabilities, attack methods can exploit them, and defence mechanisms can minimise attacks. The study examined cookie function and attributes to identify their shortcomings.
A thorough literature review was done to understand the phenomenon from previous research. The studies’ quality was carefully considered. The study used comprehensive literature review.
This study found that cookies and their environment are vulnerable to attack. The findings must inform future research. Research shows cookies have distinct defects.
According to statistics, cookies lack port, scheme, and path isolation, a negative. Cookies are weaker because they do not protect sibling domains and subdomains. Cookie attributes lack integrity. Secure, HttpOnly, and Path only protect cookie privacy. Cookies are vulnerable to attacks owing to integrity issues. Cookies’ overall security is bad.
Cookies’ vulnerabilities may be exploited by numerous attacks. Cookie poisoning, hijacking/stealing, manipulation, XSS, CSRF, and TCP/IP hijacking are all methods of exploiting the vulnerabilities. These assaults capitalise on research deficiencies. The findings should be validated by implementing the defence strategies outlined in the findings to test the effectiveness of the attack methods.
The research proposed numerous cookie defences to mitigate attacks. When transmitting the cookie over a secure connection, specify “secure.” To prevent arbitrary scripting, set HttpOnly. Configure SameSite to prevent cross-site cookie requests. In order to send cookies to specific domains, subdomains, folders, and subdirectories, the domain and path characteristics must be configured.
The results of this investigation should serve as an incentive for additional investigation. If the results are inaccurate, it is imperative to conduct a comprehensive investigation in order to identify potential solutions. Cookie defect issues have been identified in numerous studies. Take the issue into account.
References
Ansari, J. (2015). Web Penetration Testing with Kali Linux. Birmingham : Packt Publishing Ltd.
Anto, Y. (2012). The Art of Hacking. Saarbrücken : LAP LAMBERT Academic Publishing GmbH & Co
Alcorn, W., Frichot, C. & Orrù, M. (2014). The Browser Hacker’s Handbook. Indianapolis : John Wiley & Sons, Inc
Barrett, D., Weiss, M. & Hausman, K. (2015). CompTIA Security+ SYO 401 Exam Cram. Indianapolis : Pearson Education, Inc. Boland, A., Cherry, G. & Dickson, R. (2017). Doing a Systematic Review : A Student’s Guide. London : SAGE Publications Ltd.
Bangia, B. (2005). Internet and Web Design. New Delhi : Firewall Media.
Clifton, B. (2012). Advanced Web Metrics With Google Analytics. (Third edition). Indianapolis : John Wiley & Sons, Inc
Ciampa, M. (2012). Security+ Guide to Network Security Fundamentals. (Fourth edition).
Chen, F., Duan, H., Zheng, X., Jiang, J. & Chen, J. (2018). Path Leaks of HTTPS Side-Channel by Cookie Injection. Constructive Side-Channel Analysis and Secure Design.
Dubrawsky, I. (2010). Eleventh Hour Security+. Burlington : Elsevier Inc
Dubrawsky, I. (2009). CompTIA Security+ Certification Study Guide. Burlington : Syngress Publishing, Inc.
Dulaney, E. (2009). Comptia Security+ Study Guide. (7th edition). Indianapolis : John Wiley & Sons, Inc.
EC-Council. (2010). Ethical Hacking & Countermeasures : Threats and Defence Mechanisms. (2nd edition).
EC-Council. (2017). Ethical Hacking & Countermeasures : Web Applications and Data Servers.
Engebretson, P. (2011). The Basics of Hacking and Penetration Testing : Ethical Hacking and Penetration Testing Made Easy. (2nd edition). Waltham : Elsevier, Inc.
European Union. (2009). Directive 2009/136/EC of the European Parliament and of the Council of 25 November 2009. Official Journal of the European Union.
Green, J. (2015). Cyber Warfare : A Multidisciplinary Analysis. Abingdon : Routledge.
Oriyano, S. & Shimonski, R. (2012). Client-Side Attacks and Defence. Waltham : Elsevier Inc.
Wu, H. & Zhao, L. (2015). Web Security : A Whitehat Perspective. CRC Press.
Zhang, Y., Wang, Z. & Xia, C. (2010). Identifying Key Users for Targeted Marketing by Mining Online Social Network. IEEE 24th International Conference on Advanced Information Networking and Applications Workshops, 644-649.
Zhu, Y. (2016). A Book Recommendation Algorithm Based on Collaborative Filtering. 5th International Conference on Computer Science and Network Technology, 286-289


Reflective Report – Agile Development

Introduction
The world is changing and growing day by day and is moving towards digitalization. With the adoption of modern technology, Cylinder 2.0 is made to maintain supply management of cylinder in market and by maintain the stock in dealer’s shop. It solves the problem of many dealers who have been recording or keeping the data in paper and finds hard to abstract required information about stock left, sold and returned. Currently, people are facing problem with ordering gas from online. There is no any online platform for gas delivery. People have to visit the dealer’s shop to buy or exchange the cylinder/gas. People have to take it home ourselves. During the shortage it is really hard to get a cylinder even they pay double money. They have to stand in line, not sure for how many hours, until they get a cylinder by chance. Not only the customers, dealer’s and resellers are also facing the same problem. Mainly dealers are facing problem with their paper-based record keeping system. This makes problem while calculating the profit and loss, received and sold amount or quantity of gas and cylinder. There is high chance for data misplacement and data loss.
So, to keep the data safe and managed Cylinder 2.0 is built by our team “Hello World” of six members, which will help to keep the record of every transactions, supply and received cylinder and gas. This app will allow customer to order cylinder online without going to the dealer shop or gas station. They can get their gas at their home in time. This app will allow customer to pre-book the gas cylinder during shortage. This app will reduce the line of customers standing in front of dealer or reseller to get a gas cylinder. This app will help to calculate the profit and loss in contrast with the investment and also will keep record of every transaction. This system can be applied in any dealer’s shop. The system is user friendly, have good user interface and is easy to learn and use.
The app is developed by following the principles of agile scrum methodology and this report is all about the methods and way we used while developing the app.
Why Scrum?
Scrum is a popular software development framework that helps teams work together. It encourages each member of team to work and learn through the experience from work. The things that make scrum so popular is that its principles and lessons can be used in all kinds of teamwork. Scrum is a core principle of agile and a framework to get work done. Use of scrum framework helps to build agile principles into our everyday communication and work. The scrum framework is based on continuous learning. The team members do not know everything while starting the project but later on following the principles can learn many things from the working experience. It helps to adapt changing conditions and user requirements.

The reason for choosing Scrum framework is:
- It helps to define sprint goals clearly.
- It helps to make quick changes in product flexibly.
- It makes the product stable by allowing testing.
- It allows productive Scrum meeting.
- Timely Scrum feedback loops
- It helps to make the delivery on time.
- Time cohesiveness
- It helps make growth in developer.
- It helps to reduce risk.
The scrum framework is really simple to apply. Its rules, events, artifacts and roles are not hard to understand. The clear separation of roles for each members and planned events helps to make the transparency and collective ownership throughout the development cycle. Quick releases help to keep the team motivated by seeing the progress made by them.
Team Psychology
The agile provides encourages to team member to fail fast and often which helps to make quick development and significant release cycle. Mainly, it provides sound foundation for effectiveness. The philosophy of agile helps to make rapid and continuous development and improvement throughout the project. Succeed area and failure area can be identified easily by the help of agile methodology. Agile methodology allows team members to make continuous contribution and improvement by adopting the failure and mistakes. It teaches to celebrate the failure and mistakes which will help to maintain positive vibes in mind, and we can think on some good idea. In instead, the time and the effort can be applied to increase the accuracy of features. One of the tenants of Agile is about not comparing the team member. Everyone has its own capacity and talent. Thus, work is distributed among team members accordingly. The challenging concept of agile, “Failing Fast and often” is much hard to achieve than stating.

Psychology of each team member affects the working process of whole team. So, the psychology of individuals should be maintained accordingly. Unnecessary load and development make a pressure in team members. So, there should be analysis of everything within the project. Some of the members might have fear of failure which is natural. This plays a vital role in the project’s success rate. Thus, to maintain the psychology of team members following techniques were applied:
- Discussing with each members of team about their feelings towards project and encouraging them to be open.
- Area of concern were discussed openly among team members
- All the problem was discussed and solved with politeness.
- Providing opportunities for each team members for managing steps of agile methods.
Team
Team is a group of two or more than two people who were gathered for a purpose of completion of work. For the completion of large project, a team is necessary. More active the team more effective will be the work. In agile process team members have different roles for them depending on the framework and project need. Likewise, Scrum Framework have three roles, the Scrum Master, Product Owner, and the Development Team.
In this project, team of six member were chosen to complete the project and the team’s name was “Hello World”. Scrum master has played the role of Product Owner as this was our college project. Each member plays vital role for the development and completion of project. The work has been distributed among everyone accordingly. Some were developers and some were tester. Each member was assigned with a suitable task or role with respective to their understanding in developing and testing. All the member has contributed equals for the completion of work.

Scrum Master (SM): Mr. Unish Bhattrai has played a role of Scrum Master of “Hello World”. He played the role very responsibly and carefully. He was able to manage the whole project along with the team. He easily manages and solve the problems carefully, removed obstacles easily, and enhanced the productivity of team. He tried his best to maintain the progress rate of product and its completion.
Product Owner (PO): Product Owner is a one of the most responsible roles in Scrum framework. He should ensure the requirements of product that were expected to be included or not. Since this project was for college assignment, Mr. Unish Bhattrai has played the role of both Scrum Master and Product Owner himself. He had taken all the prioritize of work. He was successful to manage the product backlog and entire team. He was able to make and take the decision about the features that should be delivered. He was successful to play the role of PO responsibly and carefully.
Development Team: The team of six member were the developer of the system. All six member has played the role of developers and tried and developed the system successfully. The team was successful to deliver the work thorough the sprint. By meeting daily in Microsoft teams, the team was able to make transparency among individuals throughout the sprint. Among Six some were working in backend, some in UI design, and some in testing. Each individual has got a chance to try all the role like backend, UI design and testing in different sprint. The Development Team includes: Unish Bhattrai (SM & PO), Anish Nepal, Bhanubhakta Bhandari, Nischit Shah, Roshan Sha, Sabin Chapagain.
Team performance
To perform well team should yield bigger output. Whether the business will grow or breaks all depends on the team performance. Result of the teamwork is evaluated by their performance. Efficiently carrying out the task creates a sense of satisfaction among everyone in team.
The performance of Hello World team has been set to a good level so that all the members felt good and satisfied by their work. Everyone tried their best to enhance the performance by different tricks and principles like:
- Making clear vision: Setting standard of excellence, clarifying direction and purpose, inspiring enthusiasm and commitment etc. helps to enhance the performance of team.
- Setting goals: Setting the next target or goal in certain time push the team towards high performance level. This would inspire the team members and give a purpose to achieve the milestones.
- Making transparent work: Making the work transparent helps team member to know what and why they are doing. Sharing the intended actions among team will make the work transparent.
- Meeting regularly: Meeting time to time will help to manage the team by connecting with each individual and to address the issues. Issues and problems can be discussed through the meeting which will help to solve the problem.
- Motivating team: There should be positive and strong psychology in team member to make the performance high. The team should keep motivating the member. They can be motivated by helping in problems, listening to their problems, and not ignoring their voice.
Conflict management
All the conflicts and arguments were sorted out easily and softly by prioritizing the positive results and minimizing the negative results. As a result, performance of team has been enhanced and the team effectiveness as well by using various tricks, techniques and strategies in accordance with the situation. Although, some conflict occurred during the project cycle and were managed nicely, there was no such huge conflict that made us difficult to manage and solve.
Leadership
Talking in context of leadership, team Hello World had got good leader, not less than the better. In term of Agile what leadership means is the art of making the good environment for self-organization and self-motivation where everyone of team can learn from each other and collaborate with each other. In such environment individuals can learn continuously from their experience on work. Good leadership helps to maintain the balance with right approach and positive psychology within the team.
As a Scrum master Mr. Unish Bhattrai had played a role of leader as Servant Leader and was able to manage and balance the team by approaching to maintain the good and healthy environment for team member. He had the capacity to be a leader thus he was able to create a suitable working environment within the team. He was able to motivate the team with positive thought and setting the goals that must be achieved. He has used three leadership techniques to create the necessary environment and they are:
- Communication: He motivates to make regular communication with team members, and he ensured if the communication is carried out or not. He had a good skill of dealing with communication. He used to inspire and motivate the whole team.
- Commitment: He had good commitment over the goals and also motivates teams to be committed for the specific task. His commitment inspires every member of team and lead to the finish of product on time.
- Collaboration: He inspired team member to collaborate with each other which later help to achieve the goals. He motivated team member to work in group which will help to identify the problem and solution.
Teamwork
Working in team is not a simple work as other work. While working with team many obstacles comes and they had to be solved. It is hard to manage the conflict and other issues. However, working in team is the key to success. Teamwork can lead to the completion of project smoothly.
The team “Hello World” was able to work together with members and finish the work on time. The pandemic was running and even through that time the team was able to manage all the things smoothly. This concludes that, working in team can solve the problem that were hard to solve while working independently. All the members worked effectively and efficiently that why the team was successful to complete the project. Team motivation, positive psychology, good working environment, team collaboration, regular communication was the key of success of the team Hello World. To make the working environment good and to keep the team motivated various theories of motivation has been implemented and are listed below:
Expectancy Theory of Motivation
This theory was proposed by Victor Vroom in 1964, which states that, “the intensity of a tendency to perform in a particular manner is dependent on the intensity of an expectation that the performance will be followed by a definite outcome and on the appeal of the outcome to the individual”. It means when we are expecting good result from our work than we feel free and self-motivated to give full effort in that work. More the expectation more will be the effort and vise-versa. This theory was implemented in the team Hello World to keep expectation of outputs i.e., Cylinder 2.0 to keep the team motivated. The leader ensured about the team about what can be achieved according to the performance level. Rewarding deserving member keeps the team member motivated. The challenging tasks were most interesting to work and that helped to enhance the team’s expectation.
Maslow’s Need Theory:
This is a theory of psychology which explains human motivation based on different needs level. The theory was introduced in 1943 by Abraham Maslow, which states that, “humans are motivated to fulfill their needs in hierarchical order which begins with the most basic needs to more advanced needs”. This is very popular theory of motivation. There are five levels in the Maslow’s hierarchy that begins from basic needs to advanced needs. When person fulfilled the one level, he begins pursing next level. Basically, the theory is implemented in the team to keep the motivation following the perspective of Maslow’s theory, “as a person reaches higher levels, their motivation is directed towards these levels”. This perspective of the theory really helped the team to keep the motivation and strong support. Reaching the next level or next task team motivation and expectation were also in next level. This was the real-life implementation of Maslow’s Need Theory.
Communication
Communication plays a vital role in team management and product development. Good communication within the team leads to successful completion of product on time, whereas bad communication leads the team to breaks. Communication helps to exchange and sharing the idea and other information within team. It helps to keep the team in right track.
Team communication
To keep good communication with team member, daily standard meeting has been conducted where all the member gathered and share about their working experience, issue, and problems. For daily standard meeting Microsoft Teams has been used which is a powerful software and is very easy to use. Informally, other software and app were used like Messenger, WhatsApp, Viber etc. to be updated. The team communication was good. During the meeting all the problems were shared, and ideas were also generated by combining all the member’s thought. Time for daily standard meeting was set for 9:00 PM every day for about 15 to 20 minutes.
Issues of communication
There were not such issues in communication in the team Hello World. However, electricity and internet problem made difficulties for attending the meeting and other communicating platform like messenger, WhatsApp etc. Team was able to maintain the communication properly unless any internet and electricity problem occurs. Although, there was problem with internet and electricity, team was able to communicate with member through other methods like, member who have electricity and internet problem joined the meeting through phone call and if could not attend information of decision from the meeting was sent through SMS. In Hello World team Bhanu bhakta Bhandari was unable to join the meeting because of his electricity problem as he lives outside the valley because of the pandemic. Main factor for raising the issues in communication in team Hello World weather as there was rainy season running outside and there was lockdown during the pandemic. But he was able to catch the task details and completed in time. He called another member in team to discuss his task.
The problem with electricity and internet was not solved but the team Hello World managed to communicate with team member by using another technique.
Agile process
In agile process a software is developed, or a project is managed in such a way that the team delivers the work in small but continuously by evaluating the requirements and plans so that team can respond to quick change. So, to complete the project Hello Word team used agile methodology because of its iterative approach to software development. It helps to delivers the product faster and reduced headaches. It has different process, and all the process were followed to complete the project.
Our team

The team Hello World had six members where one was Scrum Master who played a role of Product Owner and Servant Leader, and other five were on development team. Task was assigned according to their intelligence and capability.
Agile user story
Agile User story is informal and natural language description of every feature that the application must have. User story helps the team outline the key feature of the application, what main users would need in the application and work accordingly.


Product backlog
Product backlog concludes a repository where details of user stories or requirements are tracked that are to be completed in each sprint release which is managed by Product Owner. In the team Hello World Mr. Unish Bhattrai had prioritized the requirements and other member requested for new requirement or modification accordingly.
Map board
Map board is a technique to outline the product according to the user story into the map board. All the feature of the product is arranged into the functional group. This help developer to outline the development process according to the map board. Map board improve the progress and facilitate product prioritization of development work. Map board shows how each individual user story fit into the project.

Release plan
After a product is finished developed it is to be released. On following SCRUM Methodology as the tasks are divided into sprints, application is to be released at the end of every sprint. And the plan to release the sprint is to be planned earlier before the first sprint begins which is known to be Release Plan. Similarly, we members of Hello World also had made the release plan which is shown below.

Sprint planning and sprint backlog
Sprint planning is arranging tasks to be done in the sprint. It should be conducted in collaboration with entire team. Sprint planning is done at the beginning of Sprint. In the team Hello World Mr. Unish Bhattrai (PO) planned the sprint by ensures whether the team is prepared for the most important requirement. He also ensures how the product goals be mapped.
Sprint backlog is a plan for the developer made by the developers. It is the real-time representation of work that the developers would be working throughout the Sprint. It is changed and updated throughout the Sprint accordingly. List of tasks that should be done and finished are visualized. According to the priority of backlog they are included in earlier or later steps. In the team Hello World, the sprint backlog is presented at the phase of Sprint planning with the completed task and task reaming to be done.
Sprint Backlog for Sprint 1

Sprint Backlog for Sprint 2

Sprint Backlog for Sprint 3

Sprint Backlog for Sprint 4

Sprint Backlog for Sprint 5

Sprint Backlog for Sprint 6

Sprint Backlog for Sprint 7
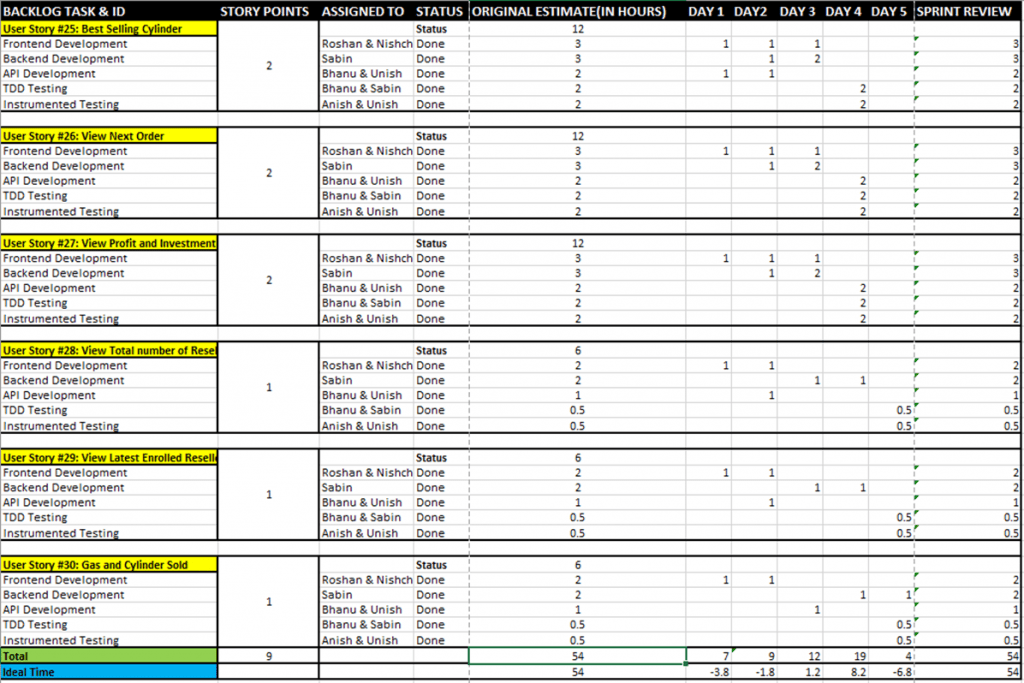
Sprint Backlog for Sprint 8

Retro
During the sprint retrospective team discuss all the thing is done during the sprint release process and product development to improving things in the future. In the retro we use to update our Trello according to our progress and update the problem that we are facing during the sprint to solve the problem I the future. We update the report of the user story to predict the burndown chart. This help team to monitor the project progress and all the change that must be adopt during the development.
[add screensoot of trello app while in meeting ]
Daily standup
Due to this ongoing pandemic, it is impossible to do establish daily standup meeting physically. So, our team have decided to use the alternative option for virtual daily standup meeting with the help of Microsoft team software. We used to conduct daily standup meeting at 9:00 pm virtually. During Standup meeting we must report the process of development to the scam master after that we use to discuss the problem that developer is facing during sprint. Daily standup meeting help to monitor the process of the development and other problems that individual developer is facing. Here is the screenshot of the daily standup meeting that we have conduct in the Microsoft team.

Screenshot shown timetable for daily standup meeting
Sprint review
Sprint review helps us to monitor the changes made in the version during the sprint according to the user story. It helps team to predict the outcome and determine the future adoption. Developer presents the work result to progress forward to achieve the goal in time. During the Sprint review, scam master explains all the work done by team and what is not done. After review team developer discuss the problem that they are facing and how they can solve them. Developer will run the project to demonstrate the project which they have completed in this sprint and answer all the questions.
[add screensoot of sprint review ]
Figure 20: Screenshot of Sprint Review
Conclusion
The purposed system for Cylinder 2.0 has been completed successfully with the implementation of Scrum (Agile Process). The team Hello World formed of six members with Scrum Master, Product Owner and Development Team. Following the Scrum process, sprint planning, sprint backlog, daily standup meeting, sprint review and retrospective was performed successfully. The communication with the team was also performed nicely. All the process and methods are reflected in this paper.
References:
What is Scrum?
https://www.scrum.org/resources/what-is-scrum
Scrum – what it is, how it works, and why it’s awesome
https://www.atlassian.com/agile/scrum
What Is Scrum Methodology? & Scrum Project Management
https://www.digite.com/agile/scrum-methodology/
The Psychology of Teamwork: The 7 Habits of Highly Effective Teams
https://positivepsychology.com/psychology-teamwork/
What makes teams work?
https://www.apa.org/monitor/2018/09/cover-teams
Team effectiveness and team performance: What it is and how to improve it | CQ Net – Management skills for everyone
https://www.ckju.net/en/dossier/team-effectiveness-and-team-performance-what-it-and-how-improve-it
Overview of Team Performance Management: Guidelines and Resources
https://managementhelp.org/groups/team-performance-management.htm
Team Performance: 5 Keys to Manage a High Performance Team
https://www.actioned.com/team-performance/
Motivation Theories [5 Famous Motivation Theories]
https://www.knowledgehut.com/tutorials/project-management/motivation-theories
What Is Story Mapping? | Agile User Stories | Create A Story Map
Theories of Motivation Explained for Business – blog
https://www.actitime.com/project-management/theories-of-motivation-in-management
Retrospective
https://www.productplan.com/glossary/retrospective/
What Is Story Mapping? | Agile User Stories | Create A Story Map
Appendix
Excel Link:
GitHub Link:
https://github.com/UnishBhattarai7/Cylinder-2.0-API.git
https://github.com/RoshanOscarSah/Cylinder-2.0.git
YouTube Link:
Technical Report – Agile Development
Version control System:
Version control help team to track, manage and change the source code over time of their program. It is an open source platform where team member can change the code throughout the program. Version control help team member to accelerate the workflow faster and smarter. This is especially used by DevOps team to increase the productivity and reduce the unmanaged code though different developer. Now different developer can change the code and push their modified code in their version control system and other developer can modify the same code by pull and push after modification. Version control software store every modified code in their special database so that user can fixed the error by comparing the earlier code without disrupting any other team member.
Benefits of Version Control:
- · Traceability: While using version control user can track the source code modified by different developer. It will provide the evidence of all the changes made in code over time. With the help of traceability mechanism team leader can see the workflow of the team by see the commits and code push by individual developer. It will track the change in code from original copy and improve the final version. And team can work in latest version throughout the program.
- · Document History: It will provide a valuable information about author and the last date of editing. It will help developer to recall all the error in earlier version to solve in the latest version problem. New team member can uncover the pattern of developing from another team to solve and improve throughout the version update.
- · Branch and Merging: Version control provide a platform where team can work on the latest version without disrupting another team member. Each member has to create their own branch in order to work on the same project with the help of multiple branches. It provides a feature to merge the individual’s code as a latest version.
- · Reduce of Duplication: Version control compare each modified code with earlier version to prevent from duplication. It will reduce the conflicting code through multiple documentation. It will enhance the security by converting read-only after final version.
- · Communication through Open Channels: Version control have an open cannel communication so that team member can transfer the code with tracking the earlier version. Team member can communicate to establish a workflow with transparency and consistency.
- · Compliance: User can store the compliance of you records files and datasets which will manage the risk. It can filter all the doc that are change by the team member.
- · Efficiency: It will provide an efficiency to the work within the team. It will simplify the complex work with automation. Throughout the update team member will change the code and revert the earlier code to detect the error.
Type of version control
· Local Version Control system:
Many developer use version control method to drop file into local directory directly. It is commonly used due to simplicity, which is increase the risk and it is an error prone. User might be overwrite the wrong code in another program.

· Centralized Version Control System:
It is introduce when they need to work with another developer. In this system have centralized single server, where all version file are contain and number of developer checkout the file from center. Centralized version control system track all the changes made by different developer and save that as a latest version.

· Distribute Version Control System:
In this version control client can fully clone the repository and all data. If any server dies client can easy clone the repository to restore into the next server and can start their work. All the data are fully backup in the repository. This system have several remote so that team can easy collaborate with other team and can share all data with one repository.

As we have to work in team for this assignment. We have choose Distribute Version Control System for storing and sharing our data with in team. And we have use Github for create the repository for the project.
Git and GitHub:
Git is a version control system, where user have to install and can maintain in a local server to provide a self-contain record of ongoing program version. It will work without internet access and easy to use. Git was design to work with text file backend code was in text file. Git introduce to the branch model then existing version control. This will allow user to create their own branch for code. It was develop by Linus Torvalds on 2005 as a way to manage the linux source code.
GitHub is a cloud base version control system. User can store version on GitHub online database which allow user to track and manage the version. User can collaborate with other developer just they have to invite the individual to your repository and other developer can merge and overwrite on latest version. GitHub allow user to track all the history and workflow in the version throughout the time. Now developer have to pull the project before coding and after completing the testing, they can push the version on the same repository. GitHub allow user to merge and compare the latest version with earlier version. GitHub will automatically find out the errors and warn the user about the issue.

Git command:

The GitHub project structure for mobile application Cylinder 2.0 (front-end / back-end).


The GitHub project structure for API of Cylinder 2.0.


GitHub Problem and How to Fix Them:
Throw out local file modification:
While coding developer have to modify the code to achieve the product. Developer approach many different code to improve the application but some time code turnout to be less ideal. In that case we can reversing the file into the earlier version which is much easier and faster.

Repeated Merge conflicts:
This is the must conflicts that developer face during version control. It is the most annoying problem to face, if developer have pass through this problem by learning underused reuse recoded feature. Developer can easily fixed it and it is a most time saver if you had fixed before.

Commit that conflict after a merge:
GitHub provide a feature called binary search facility. Now developer can track down the commit that bring conflict into the version and easily fixed the bug.

Edit commit message:
After push by developer scam master check the version. If any think is wrong or have to improve, scam master can commit a message and can edit that message for developer to understand easily.

Application Test:
The type of testing where application in tested to meet the requirement and to make the application defect free. It is conduct through script to find the error that eventually test the entire application for more effectiveness. It will save the time and cost to enhance the quality of application. Application pass through various testing like design testing, requirement testing, bug finding etc. However, testing application eventually help to identifying the loopholes, security threat. Testing should be done by following set of rule and method. In the agile testing, we have to test while integrating coding not like waterfall testing. In agile planning contain agile testing plan during sprint planning overall time.
The testing process for the agile sprint are given bellow:
- Functional testing.
- Security testing.
- UI/UX testing.
- Regress testing.
- Sanity testing.
It is important to understand the lifecycle of the agile testing. It will help us to understand the structure of the test in the agile testing. The following diagram show the agile testing lifecycle.

Benefits of the agile testing:
- Developer can test the product earlier during every sprint.
- It will save the time and money.
- Developer can find all the loopholes during jumping into another sprint.
- Product will be refine and more secure.
- It will to collect user experience regularly.
While developing application for the agile module. Our team have done to type of testing for the application, Test Driven Development (TDD) and Behavior Driven Development (BDD).
Test Driven Development (TDD)
TDD is the process of testing application before writing code. TDD make sure to pass the all test to make the application more interactive and user-friendly. Refactoring engine test the application until it will pass all the functionality to establish the clean workflow and to meet the requirement. TDD framework test automatically to instruct the developer to write the new code for more functionality.

The concept of the TDD is to test the code automatically and fixed the error before writing new code. That’s why TDD is also known as a Test First Development. It will enhance the duplication problem and developer can test the code after writing the small amount of code to reduce the chance of test fail.
Benefits of the TDD:
- Better code quality with higher version.
- Trackable the version.
- Save time.
- Much easier to maintain.
- TDD provides reliable solution.
- TDD focuses on quality code by testing all the functionality.
- Better understanding of client requirement.
Step of performing TDD Test:
First developer have to add a test to a code and execute the test. If test get passed then developer can approach to the next testing. However, if test get fail developer have to change the code and test it again until it get pass. This is the step that developer have to follow during TDD testing. TDD testing procedure is also shown in the diagram below.

Framework of TDD:
Accept debugging TDD need optimization to the development process to provide a quality product. There are various framework that support TDD and they are:
- csUnit and NUnit.
- PyUnit and DocTest.
- Junit.
- TestNG.
TDD tested on Cylinder 2.0
Cylinder 2.0 has tested all the repository.
Notification TDD test:

Member Login TDD test:

Behavior Driven Development (BDD):
Behavior Driven Development (BDD) is more develop and refine testing originated from Test Driven Development (TDD). BDD testing is human readable even non-programmers can understand. Its technology has be widely adopted and used Cucumber and Spec Flow like framework which make client to understand easily. BDD documents the application behavior that can improve the use experience. Daniel Tehorst-North was the pioneer of the BDD, he try to solve the communication issue between Developer, testers and stakeholder. BDD was facelifted by translating functionality into the Domain specific language (DSL) to make everyone understandable that will establish the communication easily. Developer can use the test solution functional of the BDD framework to assist for verifying features.
Benefits of BDD:
- Everyone Developer, client and tester can engage into the product development.
- Clarity of client scenarios that reflect the product behaviors.
- Easy to communicate.
- Non-technical human can easy understand.
- BDD focus more into behaviors then code.
- BDD framework speedup the testing process.
- BDD framework change the scenarios into automate test.
Step of performing BDD Test:
BDD is performed by writing a BDD scenarios explaining the behavior of product. That behavior are written in a specific format to covert the format automatically into the testing code. Developer have to specify the both user story and scenarios. User story explain the requirement information according to the use perspective. BDD scenarios explain the behaviors of the product after the user story input.

BDD Framework:
BDD framework automatically convert the user story and scenarios into the automatic testing. And some framework are given bellow.
- SpecFlow
- Cucumber
- Gauge
- Jasmine
BDD tested on Cylinder 2.0
BDD tests illustrate according to the user story.
Login BDD test:

Add Reseller BDD test:

Add Company BDD test:

Add Member BDD test:

Reference:
Git – About Version Control
https://git-scm.com/book/en/v2/Getting-Started-About-Version-Control
Git Tutorial: 10 Common Git Problems and How to Fix Them | Codementor
Top 20 Git Commands With Examples – DZone DevOps
https://dzone.com/articles/top-20-git-commands-with-examples
Git vs. GitHub: What’s the Difference?
Mlt.ca
https://www.mlt.ca/post/the-6-key-benefits-of-agile-testing
What is Test Driven Development (TDD)? Tutorial with Example
https://www.guru99.com/test-driven-development.html
Test Driven Development (TDD) : Approach & Benefits | BrowserStack
https://www.browserstack.com/guide/what-is-test-driven-development
12 Awesome Benefits of BDD
Behavior-Driven Development (BDD) & Testing • froglogic
https://www.froglogic.com/squish/features/bdd-behavior-driven-development-testing/
What is BDD (Behavior-Driven Development)? | Tricentis
What Are The Benefits Of Version Control? | ReQtest
https://reqtest.com/requirements-blog/what-are-benefits-of-version-control/
Appendix
Excel Link:
GitHub Link:
https://github.com/UnishBhattarai7/Cylinder-2.0-API.git
https://github.com/RoshanOscarSah/Cylinder-2.0.git
YouTube Link:

Agile Roles & Responsibilities – Vision App Sprint backlog & Storyboard
Introduction
Software development skills on the basics of development for which it requires solution and requirement changes via cooperation or any business among cross functional and self-organising teams. Main advantage of Agile development is that it allows teams to create value more quickly, with more adaptability to change and with predictability and higher quality, The two most prominent Agile techniques are Scrum and Kanban.
Agile project management methodology is a project management method which involves continual iteration and working in collaboration. At modern day, the term Agile refers to both these concepts and the frame works used to put them into action, such as Adaptive Project Framework (APF), Kanban, Extreme Programming (XP)and Scrum.
Agile Roles & Responsibilities
After reaching inside into the Scrum framework’s roles and responsibilities for Agile deployment. The following are some major distinctions in team creating exercises:
- Formation of multidisciplinary teams of cross-functional competence.
- Domain specialists having a comprehensive understanding and views on the business elements related with their job areas
- Stable team structures capable of iterating and improving SDLC procedures on an ongoing basis.
Product owner
Project stakeholder are represented by product owner, which hob is to establish the better ways for project advancement. This is primary responsibility of product development.
Product owner understand the project’s needs from the point of view of the stakeholders and possesses the required soft or fundamental skills to communicate the needs and requirements to the product of development team member. Product Owner also knows the long-term company strategy. Product owner connects the project with all stakeholders’ requirements and basic expectations. End-user feedback is used to identify acceptable next-best action strategy for development throughout the project cycle,.
Product owner’s primary tasks includes the following:
- Scrum backlogs management
- Release management
- Stakeholder management
Team lead/Scrum master
The Development Team is made up of people whose tasks never limited to project development. The development team assumes the cross functional duties required to turn a concept or need concrete product for its end users. One or more than one dev team members may have the necessary skills:
- Product designer
- Writer
- Programmer
- Tester
- UX specialist
In the development team everyone is not an engineer but they can be a part of the team. The product can get ta boosted rate if there is highly talented team. The team member should have software skills that allows them to do task more fluently and its and addition to talent. They should be self-organising and complete task while question or issues arise, development team should be capable to take situation under control.
Development Team’s primary responsibility is to complete work sprints in accordance with the Product Owner’s directions and as organized by the Scrum Master. To discuss project progress with colleagues and the Scrum Master, a daily stand-up meeting called the Daily meeting is held. This action promotes openness and allows the Team to implement modifications as needed in later sprints based on Product Owner review.
Benefits of Agile Development
- Organising Changes More Effectively:
Also breaking down the process into smaller phases, many team are able to concentrate on giving price or value without having to gather all of the requirements at early. At the conclusion of each repetition, the agile team will go over the backlog of feature and prioritize where they can spend their effort in the following sprint backlog.
- Better Customer Engagement:
Agile development requests clients majorly to get involved while in project development process. The team has to rely on clients to prioritize what information will be included in the later sprint and assess working product in duration of review meetings. This constant engagement decreases gap between what the customer needs and what the agile developers will offer.
3. Highlights on the Highest Priorities First:
Many decisions must be made in a software development environment, and it is difficult to keep track of them all. The to do list ultimately is product backlog which is visible to everybody.
4. More Productivity:
Agile developments makes greater use of client and team resources, allowing them to get up and running sooner and stay productive throughout. There is always a milestone and a deadline when work is split down into iterations. Developers are always refactoring and pushing ahead. During the exploration and design phases, they will not be idle and waiting for employment.
5. Product Owner Review:
With task divided into sprint, you may offer previous feedback, ongoing feedback, and after each one. This cooperation gives continuous chances to ensure that the agile team is on track to meet the cooperative or business objectives.
6. Increment Collaborative Environment:
Customer collaboration with individuals’ interactions, and are all valued in Agile. Throughout the process, all team members have shown their support. The project’s success is dependent on recognizing and managing every people subject matter knowledge.
7. Visible:
Agile development allows you to witness and become passionately acquainted with the project from conception to conclusion. You may offer comments as the application develops while watching it evolve.
8. Accuracy:
The team’s velocity will be known after a sprint. This enables better planning which will act as a guardian for what can be able to accomplish in future sprints.
9. Key or Main Features First:
Agile development enables member and team to give priority and have better transparency on the issues that have the most influence on the company in order to produce value more quickly.
10. Agreement on Clear Definitions (DONE):
We establish criteria for these definitions in the Agile world. “Done” might imply that it has been thoroughly tested and that it is ready for testing to stakeholder. Agile developers are more accountable, and all of us is on the same page when it comes to goals.
11. Better Transparency:
Agile is quite transparent like water. From stakeholders, clients to the development team, is aware of what is and is not being done, as well as who is making choices. Projects tend to go quicker when the entire team knows the broad idea.
Using an Agile method to project development has numerous advantages. Getting the whell rolling necessitates effort on the front end in order to enjoy the advantages of a successful project in the long run which can be fruitful.
Scrum
Scrum simply means the methodology for solving complex issues while delivering, producing solution in creative and productive way.
Scrum helps individuals since it is light weight framework, organizations and team members makes value by allowing them to adapt to tougher problems. Scrum co-creators Ken Schwaber and Jeff Sutherland created Scrum Guide to teach Scrum in a simple and also in concise manner. Scrum’s events and accountabilities, artifacts, and the guide that chain them together.
Scrum compels to create an environment for Scrum Master which consists of following:
- Product manager orders task for a solution and difficult problem using backlog.
- While in each Sprint, the Scrum group adjusts selection of work for more value increment.
- Scrum Team and its clients evaluate the outcomes and defines the requirement for up coming sprints.
- Now its repeated till done.
The Scrum Framework
Scrum is very straightforward. The polar opposite of a hard or complex web of interconnected necessary component overall. Scrum is a process, not a technique. Scrum employs empiricism as a scientific technique. In order to deal with unpredictability and handle complex challenges, Scrum substitutes a programmed structure algorithmic technique with a furious approach based on respect to person and self – organization. Ken Schwaber and Jeff Sutherland has stated in their software book, takes us from planning of software through delivery in action of scrum.

The Scrum Events
Scrum uses predefined events to enhance consistency and eliminate the need for non-Scrum meetings. All events have a time limit. A Sprint’s duration is set once it begins and cannot be decreased or prolonged. The other remaining events may be terminated if the events objective is met or removed, ensuring that a sufficient time is spent without permitting change in the process. The Scrum Events in process are as follows:
- Sprint.
- Sprint planning.
- Daily scrum.
- Sprint review.
- Sprint retrospective.
Extreme programming (XP)
Extreme Programming is a project or software development approach and its objective is to increase the quality of project and its flexibility regarding the adaption to changing customer or clients demands.
While working on the Chrysler Comprehensive Compensation System (C3) to assist manage the company’s compensation in the mid to late 1990s, software developer Ken Beck pioneered the Extreme Programming technique. He published Extreme Programming Explained in 1999, which explained the entire technique for other group member, and in short time thereafter, the official website was launched. Extreme Programming, like other Agile development methods, sees to give repeated and frequent minor releases in process of the project, this allows both members and customers to monitor and analyse the project’s completion across SDLC.

Here are particular perspectives on SDLC as follows:
- V – Model
- Conceptual Model
- Test – Driven Development
- Rapid Application Development
Extreme Rule
- Planning.
- Managing.
- Designing.
- Coding.
- Testing.
Extreme Practices
- Pair Programming
To sum up, pair programming means that two individuals work in the team on the same project at the same time interval to produce any production code. Extreme Programming encourages improved communication and teamwork by constantly switching partners within the team.
- Planning game
This frequently takes the shape of a meeting at a regular and well-defined interval (every one or two weeks), when the majority of project planning takes place. Phases are like Steering Phase, Exploration and Commitment.
- Tests Driven Development
Test is fundamental part of extreme programming; the idea is known by all developers widely. Code is written for testing, when test is passed the project is passed for future production.
- Seamless integration
The main concept about Seamless integration, there is many developers that has to code at same time and push and merge to one common repository. That can be challenging and many individual can face problem which can be solved by discussing in team.
Dynamic System Development Method (DSDM)
The Dynamic Systems Development Method (DSDM) is agile way in which it addresses both whole project lifecycle to complete it and its commercial impact. DSDM, like larger agile concept, is more iterative way for the software development, and the framework specifically says that “any project must be linked to well defined strategic goals and focus on early delivery of tangible business benefits.” Four key concepts underpin the approach, implementation and also business analysis design and build iteration, and implementation, , functional model and prototype iteration.

Strengths and Weakness
DSDM’s advantages are:
- basic product functionality may be supplied quickly.
- End consumers are easily accessible to developers.
- Projects are consistently finished on schedule.
DSDM’s flaws are:
- Can represent a significant and disruptive shift in business culture
- Implementation is expensive.
- Not suitable for small businesses.
Eight Principles
The fundamental concepts of the dynamic systems development method are:
1. Business Focus:
Team in DSDM should develop a feasible business scenario and maintain support of organization throughout the scrum project.
2. On Time Delivery:
We should be helpful and predictable so that we can be trusted by all development team and we can have project deliver in time.
3. Collaboration:
Client must be included in DSDM teams throughout the project and give decision-making authority to all team members.
4. Qualitative:
To ensure best quality continuous testing should be done, review should be taken and proper documentation should be done. Business agrees with quality while making product backlog.
5. Create gradually from solid foundation:
Project teams should guarantee that they know what to develop for the project. They also should not spend more time on understating which may lead to time loss. They must understand enough design work.
6. Developer repetition:
Take feedback from the company and utilize it to improve with each development iteration. Teams must also identify and respond to details that arise as the project or product evolves.
7. Clear and continuous communication:
Making prototype, having daily stand-up meetings are important DSDM tools. There should also be fostering informal communication and holding workshops, since they are also important. Small current and short document can be made if necessary. Large documentation is not necessary.
8. Demonstration control:
Every one in project should be crystal clear of what is happening and must have knowledge in DSDM process. All the plan and its progress should be known by each individual of a team.
Similarities and Differences
| P r a c t I c e s | S c r u m | X P | D S D M |
| Accession (Approach) | Repetitive Increments | Increments are Repetitive | Repetitive |
| Time (week) | 2to 4 weeks | 1to 6 weeks | 80% solution in 20% time |
| Team Size | 5-10 | Small team, 2-9 | 2-9, Independent Individual teams |
| Suitable Project size | Any types | Small size projects | Any types |
| Major Practices | Sprint, Scrum meetings, Product Backlog, Sprint Backlog | pair programming, pair programming, User stories, refactoring | Prototyping, practicality , business study |
Scrum as best methodology
Below are some of my strong points to suggest Scrum is best methodology:
- The burn down charts is commonly used for tracking sprint progress. In planning graphical representations outperform the tabular list views.
- Planning poker, an effective method for determining sprint item completion times. Using Fibonacci numbers to design poker numbers is also a useful technique.
- ROI (Return on Investment) numbers may be used to prioritize items in any sprint. To calculate return on investment planning poker can be used.
- For process quality equipment, a map board and release planning/reporting software or tools like excel, sprint meter are enough. These tools can boost the releasing plan making further.
- Scrum technique does not require all documentation, but this does not imply “no documentation.” Documentation that is mainly necessary can be completed as per need.
- Scrum is agile method and daily meeting can be up to 15 min maximum, so other people in team doesn’t have to listen all problem of team. The issues in the meeting can be handled by scrum master and can resolve with subset of scrum team members easily.
- To keep meetings brief, stand-up meetings are preferable for everyday meetings. It is also advised that the meeting place and time should be at same day and every day.
- Product backlog can include products that may not be made. Some things may not be created based on ROI values, which is normal. In any case, the product backlog should include all conceivable products. Give backlog items ID numbers to make management easier.
- Changes in sprint length (in weeks) are not advised. Sprint week lengths, however, may be altered based on the findings of the sprint retrospective meeting if there are very compelling reasons.
- 6 hours each day is a reasonable amount of time to plan. All sprint hour is calculated by (no. of team members in scrum) * (no. of sprint in days) * 6 hours.
Vision App
Vision app is designed for Arbind Eye Care and Optical Centre. This app purpose is to sell sunglasses, contacts to customers. People can also make appointment using app.
User Story
User stories are a critical component of every agile development. They contribute to the creation of a user-centred framework for everyday work, which fosters cooperation, innovation, and a better product overall.


Personas
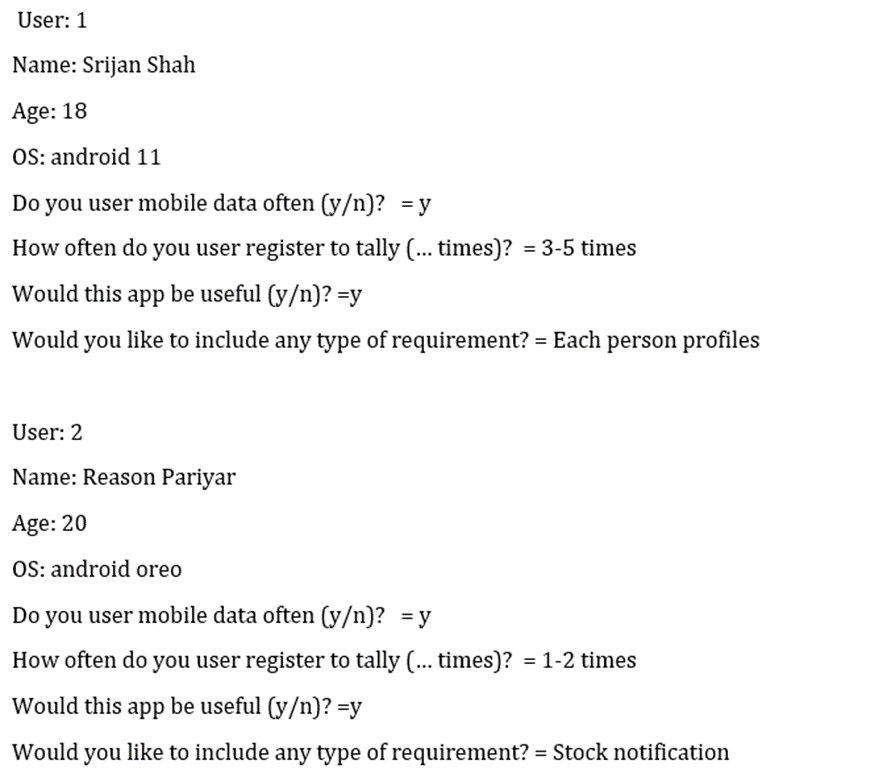


Team Size
Individuals dedicate themselves to the Scrum team’s objectives. The members of the Scrum Team have the guts to do what is right and deal with difficult issues. Priority is majorly the task regarding the Sprint and the objectives of Scrum team is a priority for everyone. Stakeholder or client and Scrum Team agrees that they can do any work and deal with the difficulties faced during sprint. In scrum both member and stake holder respect each other. I have chosen 5 Team members for this scrum app development.

Priority


Story Map Board


Release Plan
The purpose of the Release Plan is to decide when various sets of usable goods or features will be delivered to the customer, allowing the Scrum Team to keep track of the product’s releases and delivery timetable.
Acceptance Criteria
Acceptance criteria are likely to be known to agile development teams. However, when it comes to separating acceptance criteria and test combinations, teams frequently feel overburdened. Acceptance criteria are described as “conditions that a software product must fulfil in order for a user, customer, or other stakeholder to accept it.” (Source: Microsoft Press) This is a set of statements that specify a user’s needs or the features and functions of an application.
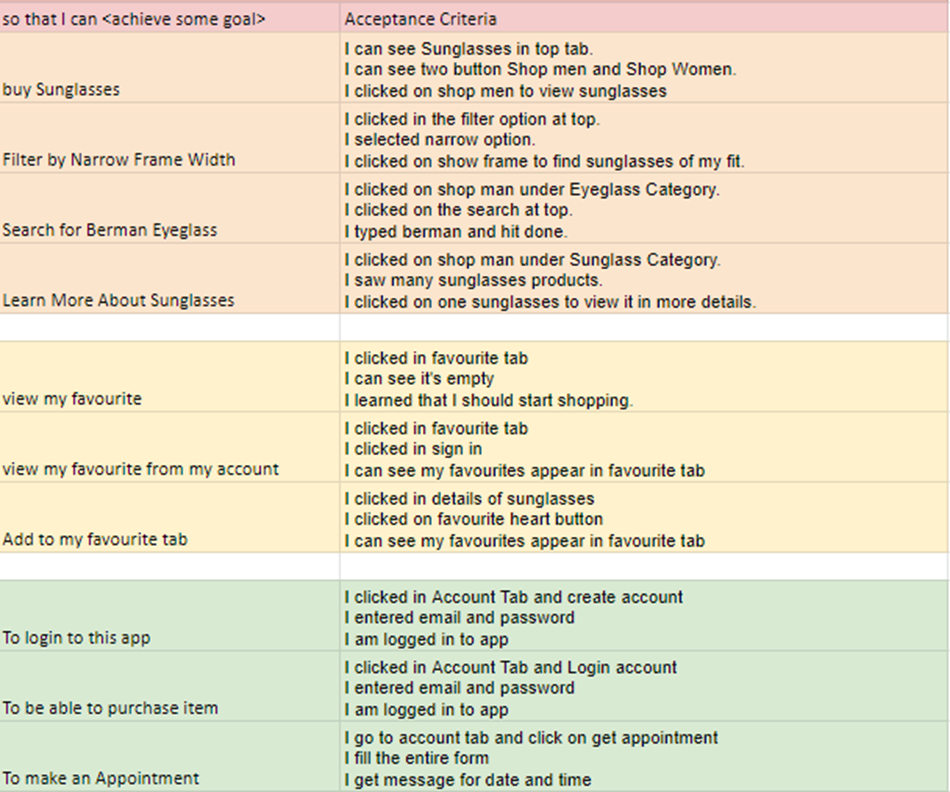

Sprint planning and backlog
Scrum methodology is used while designing app. Product backlog is included in sprint backlog. To meet sprint objective, a team makes sure to complete all product backlog with conclusion.
Product backlog are added to make a complete project. Product owner adds all backlogs to sprint planning. Team owns the sprint backlog and it has the authority to make decision whether to add new things or delete old ones. This allows the team to focus on their goal for each sprint. Team member can add to product backlog if individual have idea in addition to existing backlog.
Spring planning is the framework in which team has to work within the sprint and planning can be done while initializing sprint. Each individual in a team can initialize their own way to achieve goal.
During the sprint, team can see the main sprint objective and use it as or pillar for the decision making in product backlog item. Since improving project performances.
Conclusion
While designing Vision app through scrum, I look closed to understanding of user requirement. Good Team with five people is chosen, story mapping is done properly with product backlog. Released plan is made with detailed explanation. Story point, time period estimated were discussed. Detail explanation of acceptance criteria based on the user stories is made possible using scrum.
Spreadsheets Link:
https://docs.google.com/spreadsheets/d/1ULkId4K1YBzgqOMeitWRoQUFeNsnqlCHZaCtegFgmlE/edit?usp=sharing
References
Productplan.com. 2021. Dynamic Systems Development Method (DSDM). [online] Available at: <https://www.productplan.com/glossary/dynamic-systems-development-method/> [Accessed 9 September 2021].